Google Analytics 4 Walkthrough
- 6 Minutes to read
- Print
- DarkLight
- PDF
Google Analytics 4 Walkthrough
- 6 Minutes to read
- Print
- DarkLight
- PDF
Article summary
Did you find this summary helpful?
Thank you for your feedback!
Introduction
Google Analytics 4 (GA4) on Rivery allows seamless integration of GA4 data into data warehouses. This integration automates data extraction, enabling efficient analysis.
Connection
To connect Google Analytics 4 (GA4) with your destination, follow our step-by-step tutorial.
Choose a Source connection after you've created a connection, as seen here:

Predefined Reports
Rivery provides a convenient entry point and recommended approach for accessing a range of predefined reports for your use. Each report includes a concise data description, a list of customizable fields (if applicable), and the schema mapping.
Since these reports follow a standardized format, specific fields are restricted and can only be accessed through Custom Reports.

Custom Reports
Google Analytics 4 (GA4) provides advanced tracking and analysis capabilities to help businesses gain valuable insights into user behavior and website performance. In GA4, there are two main types of reports available:
- Cohort Report
- Standard Report.
This document will provide an overview of both report types.

To learn more about the Google Analytics Data API, refer to Google's documentation.
Prerequisites
- A currently active Google Analytics account.
- A valid Google Analytics connection in Rivery.
GA4 Cohort Report
The Cohort Report enables the analysis of user behavior within specific user groups during a designated time frame. A cohort refers to a group of users who have a shared characteristic or experience within a defined period. By using the Cohort Report, you can gain valuable insights into the long-term behavior of these user groups, allowing you to monitor user acquisition on a daily, weekly, or monthly basis.

GA4 Standard Report
The Standard Report in GA4 provides pre-configured insights into various aspects of your website or app performance. This report covers areas such as audience, acquisition, behavior, and conversions, allowing you to understand user behavior, traffic sources, popular content, and conversion rates.

Time Period
This report allows you to extract data by selecting a time period.

Please Note:
- Start Date is mandatory.
- Data can be retrieved for the date range specified between the Start and End dates.
- If you leave the End Date blank, the data will be pulled at the current time of the River's run.
- Dates timezone: UTC time.
- The Start Date won't be advanced if a River run is unsuccessful.
If you don't want this default setting, click More Options and check the Update incremental date range also on failures box to advance the start date even if the River run is unsuccessful (Not recommended). - Use the 'Last Days Back For Each Run' option to gather data from a specified number of days prior to the selected start date.
Time Chunk Size
This feature enables you to partition your data into intervals, which proves to be beneficial when working with large data volumes. By specifying the size of the interval, the data will be divided accordingly, allowing for more manageable data calls.

Dimension and Metrics
GA4 provides businesses with insights into user behavior and website performance.
Dimensions represent user attributes, while metrics offer quantitative measurements. Together, they help analyze data, gain audience insights, and optimize marketing strategies. By segmenting data and tracking performance, businesses can make informed decisions to achieve their goals.
Dimensions
Dimensions in GA4 represent characteristics or scopes of events, users, or items. They provide descriptive information that helps segment and categorize data. GA4 includes predefined dimensions such as user ID, device type, country, and traffic source, which offer valuable insights into user behavior and demographics.

Metrics
Metrics in GA4 represent measurable data points that quantify user interactions, conversions, and key performance indicators. GA4 provides a wide range of predefined metrics such as pageviews, sessions, bounce rate, and average session duration, giving a comprehensive view of website or app performance.

Please Note:
- You have the option to choose up to 9 Dimensions and 10 Metrics.
- Explore Dimension or Metric descriptions using the GA4 Dimensions & Metrics Explorer for reviewing purposes.
Advanced Options
In the Advanced Options section, you will find the Custom Dimensions and Metrics feature. Custom dimensions and metrics refer to dimensions and metrics that are personally created by you. These customized elements enable you to examine data that caters to your unique business requirements. They prove valuable when establishing custom event parameters or user properties.

Prerequisite
In order to create custom dimensions and metrics, it is required that you possess either the Editor or Administrator role.
How to Create Custom Dimensions
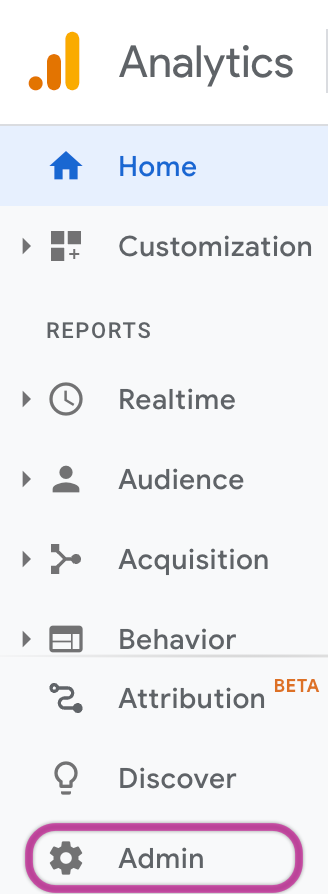
- Click on the Admin option within Google Analytics.
- Access the Custom Definitions section located within the Property column.
- In the Custom dimensions tab, click Create custom dimensions.


- Provide the following details:
a. Name of the dimension: Please enter a distinct name for the dimension.
Hyphens are not allowed in the name, but you can use underscores and spaces instead.
b. Scope: Please select a scope for the customized dimension.
c . Description: Please provide a memorable description for the customized dimension.
d. Event parameter/User property: Please choose the data source.
- Click Save.
Please note that during the initial 48 hours, you will see a value of "(not set)" assigned to your custom dimension.
How to Create Custom Metrics
- Repeat the 1-2 steps from the section on creating custom dimensions.
- In the Custom metrics tab, click Create custom metrics.

- Provide the following details:
a. Name of the metric: Please enter a distinct name for the metric.
Hyphens are not allowed in the name, but you can use underscores and spaces instead.
b. Scope: Please ensure that you create a metric scoped to an event.
c. Description: Please enter a memorable description for the custom metric.
d. Event parameter: Please select the data source for the metric.
e. Unit of measurement: Please choose the appropriate unit of measurement.
- Click Save.
Please note that during the initial 48 hours, you will see a value of "(not set)" assigned to your custom dimension.
For additional details regarding Scopes, Units of measurement, and the Source of data, we recommend referring to the documentation provided by Google Analytics.
Sub Rivers in GA4
Google Analytics 4 introduces a set of Sub River Fields. These fields allow users to delve deeper into the analytics data and gain more specific insights from their website or app performance:
- Account IDs
- Source Connection
- Account Properties
- Time Period
- Target Connection
- Database Name
- Schema
Optimizing Loading Errors through Expression Casting
In case you're utilizing Snowflake or Bigquery as your target, you may encounter the following error if the expressions are not cast correctly:
Loading failed: Merge into DB.SCHEMA.GA_sessions failed. Error - ('22007', "[22007] Can't parse '0' as date with format 'YYYYMMDD' (100097) (SQLExecDirectW)")
To prevent this error, please apply the recommended expression as indicated below:

When using Snowflake as the Target, use the following expression:
CASE WHEN date = 0 THEN '1900-01-01'::DATE ELSE TO_DATE(CAST(date AS VARCHAR), 'YYYYMMDD')::DATE END
When using Bigquery as your Target, use the following expression:
SAFE.PARSE_DATETIME("%Y%m%d", CAST(date AS STRING))
Google Analytics 4 API Filtering Limitations
Google Analytics prioritizes user privacy, hence if your query involves restricted data (such as demographics) or is overly specific (like recent timeframes and intricate filters), there might be a decrease in results.
In the event of a noticeable decline, consider extending your timeframe, streamlining filters, or promoting the opt-in for Google Signals to access more comprehensive data.
Steps to prevent data loss in Google Analytics and its API:
- Reduce Number of Filters:
- Minimize the number of filters for essential analysis.
- Avoid non-crucial filters.
- Merge Filters:
Combine multiple filters into a comprehensive one for efficiency.
- Widen Filter Criteria:
Make filter conditions less specific to capture a broader data range.
For instance, filter for a category rather than a specific page.
- Remove Unnecessary Dimensions:
Remove dimensions that aren't directly relevant to your analysis.
- Explore Alternative Dimensions:
Consider using alternative dimensions for similar insights with less complexity.
For example, filter by region instead of city.
Consistency in Dimension and Metric Usage:
Ensure that you employ identical Dimensions and Metrics in both Rivery and Google Analytics.Adjust Timeframes:
Expand the query timeframe to access more data, particularly with less common dimensions or filters.
By applying these strategies, you can simplify filters effectively, ensuring smoother data retrieval and potentially avoiding unexpected drops in result counts.
Was this article helpful?