Universal Analytics Predefined Reports
- 4 Minutes to read
- Print
- DarkLight
- PDF
Universal Analytics Predefined Reports
- 4 Minutes to read
- Print
- DarkLight
- PDF
Article summary
Did you find this summary helpful?
Thank you for your feedback!
Predefined Reports
The Google Analytics Universal API datasource in Rivery comes with the below predefined reports. Each report will have a short description of the data, a list of customizable fields (if any), and the schema mapping. Due to the standardized nature of these reports, there are a number of locked fields that will only be accessible through the custom reporting functionality.
Prerequisite
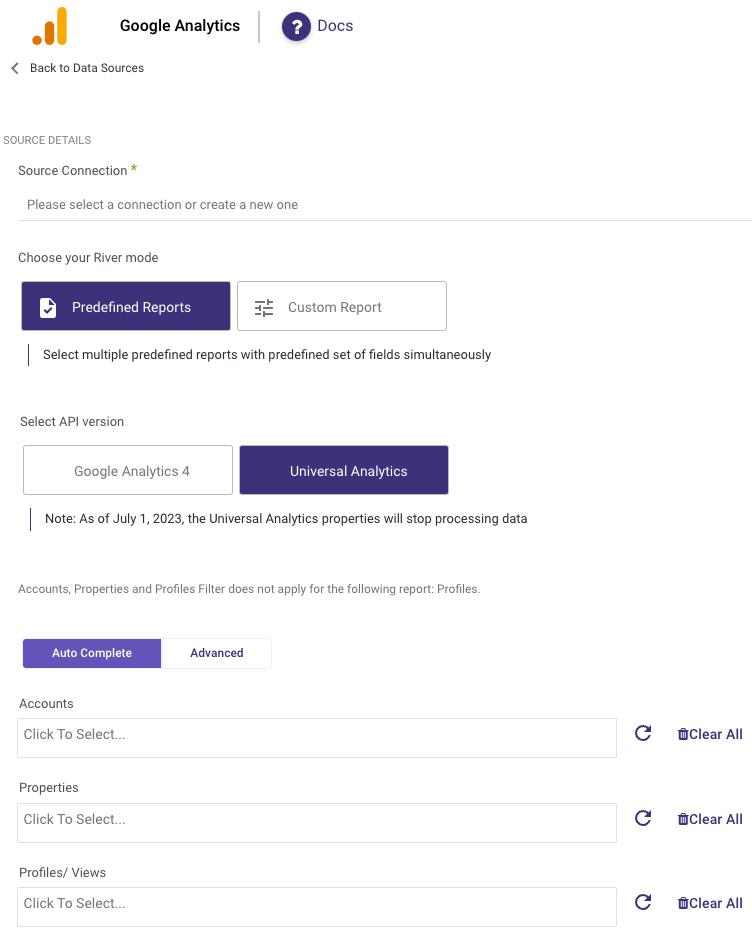
To use Universal Analytics Predefined Reports in Rivery, you must initially adhere to the following instructions:
- Choose "Predefined Reports" as your River mode.
- Select the API version as "Universal Analytics".
- Choose your "Accounts".
- Select your "Properties".
- Pick your "Profiles/ Views".
Standard Sessions
The Standard Sessions report produces a session based metrics table at the ad content and source/medium level. There are two customizations the user can make to this report. They can use the filter option to cut down the output and can customize the type of incremental load associated with this report.
| Field | Data Type | Dimension/Metric |
|---|---|---|
| date | Integer | Dimension |
| account_id | Integer | Dimension |
| keyword | String | Dimension |
| avgsessionduration | Float | Metric |
| bounceRate | Float | Metric |
| bounces | Integer | Metric |
| campaign | String | Dimension |
| channelgrouping | String | Dimension |
| adcontent | String | Dimension |
| account_name | String | Dimension |
| medium | String | Dimension |
| newusers | Integer | Metric |
| pageviews | Integer | Metric |
| percentnewsessions | Float | Metric |
| sessionduration | Float | Metric |
| sessions | Integer | Metric |
| source | String | Dimension |
| transactions | Integer | Metric |
| users | Integer | Metric |
Standard Events
The Standard Events report produces an events based metrics table at the event, ad content, and source/medium level. The user can only customize the type of incremental load associated with this report.
| Field | Data Type | Dimension/Metric |
|---|---|---|
| date | Integer | Dimension |
| property_id | String | Dimension |
| account_id | Integer | Dimension |
| eventlabel | String | Dimension |
| campaign | String | Dimension |
| adwordsCampaignID | String | Dimension |
| eventaction | String | Dimension |
| adcontent | String | Dimension |
| eventsPerSessionWithEvent | Float | Metric |
| keyword | String | Dimension |
| account_name | String | Dimension |
| sessionswithevent | Integer | Metric |
| sourcemedium | String | Dimension |
| totalevents | Integer | Metric |
| uniqueevents | Integer | Metric |
Standard Users
The Standard Users report produces a user based metrics table at the user type level. The only customization is the type of incremental load associated with this report.
| Field | Data Type | Dimension/Metric |
|---|---|---|
| account_id | Integer | Dimension |
| date | Integer | Dimension |
| account_name | String | Dimension |
| deviceCategory | String | Dimension |
| newUsers | Integer | Metric |
| referralPath | String | Dimension |
| region | String | Dimension |
| userType | String | Dimension |
| useragebracket | String | Dimension |
| usergender | String | Dimension |
| users | Integer | Metric |
Standard Weekly Users
The Standard Users report produces a user based metrics table at the user type level aggregated over a weekly time period. The only customization is the type of incremental load associated with this report.
| Field | Data Type | Dimension/Metric |
|---|---|---|
| account_id | Integer | Dimension |
| yearWeek | Integer | Dimension |
| account_name | String | Dimension |
| deviceCategory | String | Dimension |
| newUsers | Integer | Metric |
| region | String | Dimension |
| userAgeBracket | String | Dimension |
| userGender | String | Dimension |
| userType | String | Dimension |
| users | Integer | Metric |
| referralPath | String | Dimension |
Standard Monthly Users
The Standard Users report produces a user based metrics table at the user type level aggregated over a monthly time period. The only customization is the type of incremental load associated with this report.
| Field | Data Type | Dimension/Metric |
|---|---|---|
| account_id | Integer | Dimension |
| yearMonth | Integer | Dimension |
| account_name | String | Dimension |
| deviceCategory | String | Dimension |
| newUsers | Integer | Metric |
| region | String | Dimension |
| userAgeBracket | String | Dimension |
| userGender | String | Dimension |
| userType | String | Dimension |
| users | Integer | Metric |
| referralPath | String | Dimension |
Cohort By 7 Days
The Cohort by 7 Days report produces a cohort based metrics table at the profile level aggregated over the last 7 days. The user can only customize the report's filter option to cut down the output.
| Field | Data Type | Dimension/Metric |
|---|---|---|
| account_id | Integer | Dimension |
| cohort | String | Dimension |
| property_id | String | Dimension |
| profile_id | Integer | Dimension |
| goalCompletionsAll | Integer | Metric |
| cohortRetentionRate | Float | Metric |
| cohortTotalUsers | Integer | Metric |
| cohortNthDay | Integer | Metric |
| pageviews | Integer | Metric |
| cohortGoalCompletionsPerUser | Float | Metric |
| cohortActiveUsers | Integer | Metric |
| sessionDuration | Float | Metric |
| sessions | Integer | Metric |
| transactionRevenue | Float | Metric |
| transactions | Integer | Metric |
Mcf Conversion Path
The Multi-Channel Funnels Conversion Path report shows all of the unique conversion paths that led to conversions, as well as the number of conversions from each path, and the value of those conversions. There are two customizations the user can make to this report. They can use the filter option to cut down the output and can customize the type of incremental load associated with this report.
| Field | Data Type | Dimension/Metric |
|---|---|---|
| conversionDate | Integer | Dimension |
| conversionType | String | Dimension |
| profile_id | Integer | Dimension |
| timeLagInDaysHistogram | Integer | Dimension |
| totalConversionValue | Float | Metric |
| totalConversions | Integer | Metric |
Mcf Time Lag
The Multi-Channel Funnels Time Lag report counts the number of days from the first ad impression to conversion. There are two customizations the user can make to this report. They can use the filter option to cut down the output and can customize the type of incremental load associated with this report.
| Field | Data Type | Dimension/Metric |
|---|---|---|
| campaignName | String | Dimension |
| conversionDate | Integer | Dimension |
| profile_id | Integer | Dimension |
| timeLagInDaysHistogram | Integer | Dimension |
| totalConversionValue | Float | Metric |
| totalConversions | Integer | Metric |
Mcf Assisted Conversions
The Multi-Channel Funnels Assisted Conversions report summarizes the channels' roles and contributions. There are two customizations the user can make to this report. They can use the filter option to cut down the output and can customize the type of incremental load associated with this report.
| Field | Data Type | Dimension/Metric |
|---|---|---|
| medium | String | Dimension |
| source | String | Dimension |
| basicChannelGrouping | String | Dimension |
| campaignName | String | Dimension |
| conversionDate | Integer | Dimension |
| conversionGoalNumber | String | Dimension |
| conversionType | String | Dimension |
| profile_id | Integer | Dimension |
| assistedConversions | Integer | Metric |
| lastInteractionConversions | Integer | Metric |
| lastInteractionValue | Float | Metric |
| firstInteractionValue | Float | Metric |
| firstInteractionConversions | Integer | Metric |
| assistedValue | Float | Metric |
| totalConversionValue | Float | Metric |
| totalConversions | Integer | Metric |
Mcf Path Length
The Multi-Channel Funnels Path Length report shows how many conversions resulted from conversion paths that contained 1, 2, 3, 4, 5, 6, 7, 8, 9, 10, 11, or 12+ channel interactions. There are two customizations the user can make to this report. They can use the filter option to cut down the output and can customize the type of incremental load associated with this report.
| Field | Data Type | Dimension/Metric |
|---|---|---|
| campaignName | String | Dimension |
| conversionDate | Integer | Dimension |
| pathLengthInInteractionsHistogram | Integer | Dimension |
| profile_id | Integer | Dimension |
| totalConversionValue | Float | Metric |
| totalConversions | Integer | Metric |
Was this article helpful?