Google Search Console Walkthrough
- 3 Minutes to read
- Print
- DarkLight
- PDF
Google Search Console Walkthrough
- 3 Minutes to read
- Print
- DarkLight
- PDF
Article summary
Did you find this summary helpful?
Thank you for your feedback!
Introduction
Google Search Console (GSC) helps website owners monitor and optimize their site's performance in search results. It offers insights into search traffic, indexing issues, and site security, and allows users to submit sitemaps and check URL status.
Integrating Google Search Console with Rivery enables automated data pipelines, custom data transformations, and centralized reporting. This integration helps businesses efficiently analyze and leverage GSC data alongside other data sources for comprehensive insights and improved decision-making.
Connection
To connectGSC with your destination, follow our step-by-step tutorial.
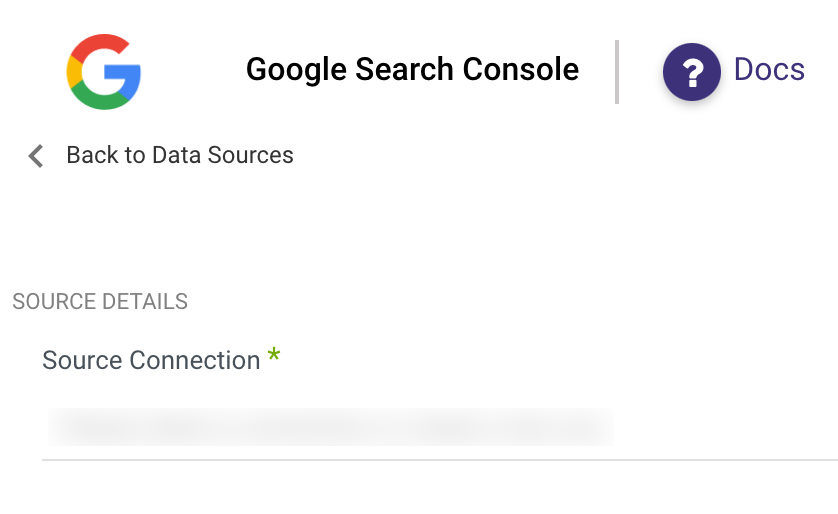
Choose a Source connection after you've created a connection, as seen here:
Reports
Search Analytics Report
The analytics report is the main data source from Search Console.
Query your search traffic data with parameters that you define. The report generates zero or more rows grouped by the row keys (dimensions) that you define. You must define a date range of one or more days.
- Click on "Sites" to load a list of your available sites. Select which sites you wish to the generate the report for. You can leave this input empty if you want all of your sites to be on the report.
- Select which Dimensions (keys) to group by. Results are grouped in the order that you supply these dimensions. The grouping dimension values are combined to create a unique key for each result row.Please Note:The Search Appearance dimension is exclusive and cannot be combined with any other dimension.
- Select the Search Type to filter for:
"Image": Image search results
"Video": Video search results
"Web": [Default] Web search results - Select the Aggregation Type - How data is aggregated:
"Auto": [Default] Let the service decide the appropriate aggregation type.
"Page": Aggregate values by URI.
"Property": Aggregate values by property.Please Note:Aggregating by property is not possible when you group by page. Select the dates for the report. You can choose your own custom date range, or use one of the ready-made options from the 'time period' list.
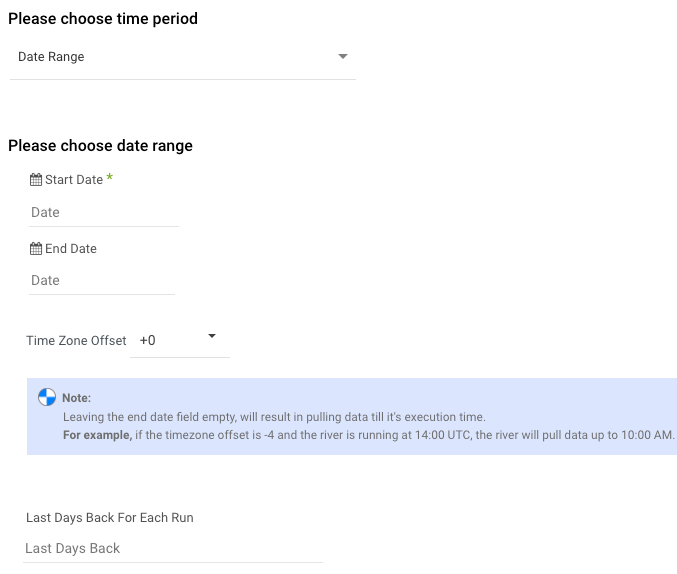
Select the type of time period of the report.
It can be a custom date range (as described in the picture above) or a defined time period shown in the pop-up list (for example Yesterday, last week, previous month until today's date, etc.)
Instructions if selecting ‘Date Range’:
- Select the start date and end date.
- Leave the end date empty in order to pull data until the moment the river runs.
- After each run of the river, the start date will be updated automatically with the end date, and the end date will be updated with the empty value. This enables the next run to pull data from the end of the previous run.
- Select the time zone offset. It will be relevant only if the end date is empty in order to find the moment of the river’s run according to the time zone.
- Days back - use this input to tell Rivery to pull data from the given days back before the given start date.
- Instructions if selecting any other value:
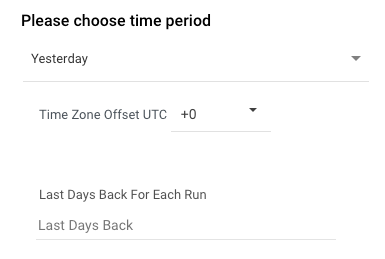
- Select the time zone offset in order to send the correct dates that consider this offset.
6. Select the 'Time Resolution' (Granularity) for the report. This will group the results by each set of dates. 'daily' would be a row for each date, 'weekly' would be a row for each week, etc. 'total' would be a row for the entire selected date range.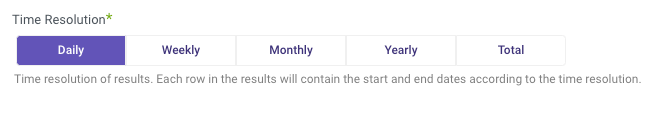
Please Note: a "daily" resolution report will include a date column which is the actual date of the row and the startDate & endDate columns which are the requested date range from your river.
Sitemaps Report
Lists the sitemaps-entries submitted for this site, or included in the sitemap index file (if Sitemap Index is specified).
* Note that Domain properties are not supported, only URL-prefix properties.
- Click on "Sites" to load a list of your available sites. Select which sites you wish to the generate the report for. You can leave this input empty if you want all of your sites to be on the report.
- [Optional] insert a URL of a site's sitemap index. For example: http://www.example.com/sitemapindex.xml
Was this article helpful?