Adaptive Planning Walkthrough
- 2 Minutes to read
- Print
- DarkLight
- PDF
Adaptive Planning Walkthrough
- 2 Minutes to read
- Print
- DarkLight
- PDF
Article summary
Did you find this summary helpful?
Thank you for your feedback!
Adaptive Planning API version 32 is currently supported
Introduction
Rivery supports the integration of Adaptive Planning reports, allowing users to extract data seamlessly from their Adaptive Planning instances.
This document provides guidelines for using the Adaptive Reports in Rivery, focusing on the General Reports and the Export Data Report.
General Reports
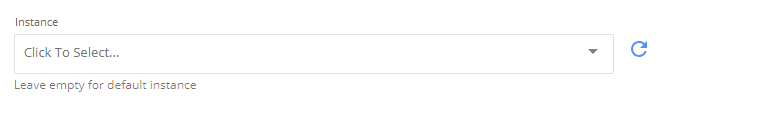
The Instance Selection Input Box is crucial for all Adaptive Planning reports. If your account has multiple Adaptive instances connected, this input box allows you to choose the specific account from which to pull data.
Leave the input box empty if:
- You wish to pull data from your default instance.
- You only have one instance connected.
Export Data Report
The Export Data Report is the primary report for extracting raw data from Adaptive Planning. It mirrors the functionality of the export data report available in the Adaptive console.
Steps to Configure the Export Data Report:
Select the Report
Begin by selecting the Export Data Report from the Adaptive console.Choose a Version
Select the required version or leave the input box empty to use your account’s default version.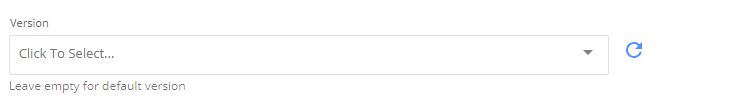
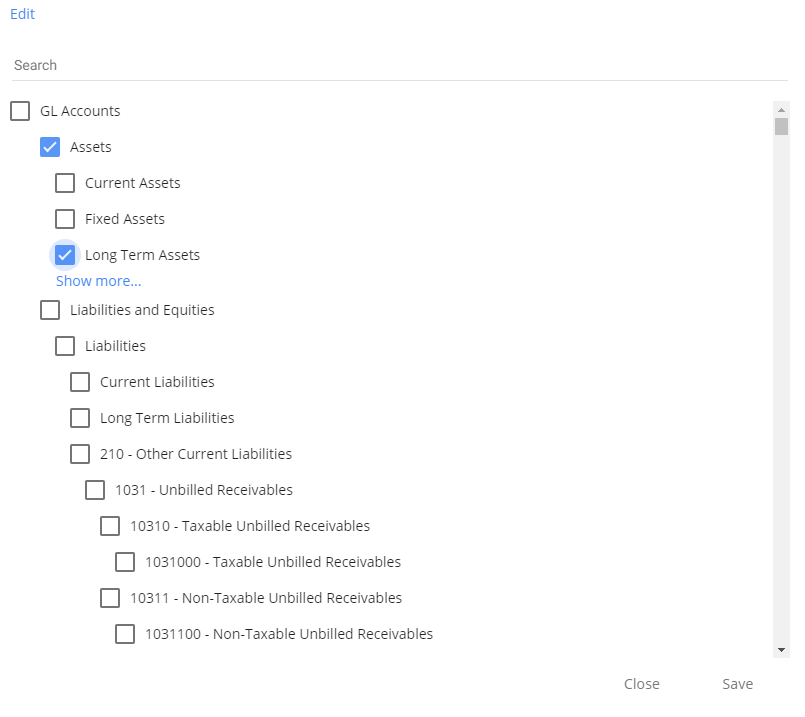
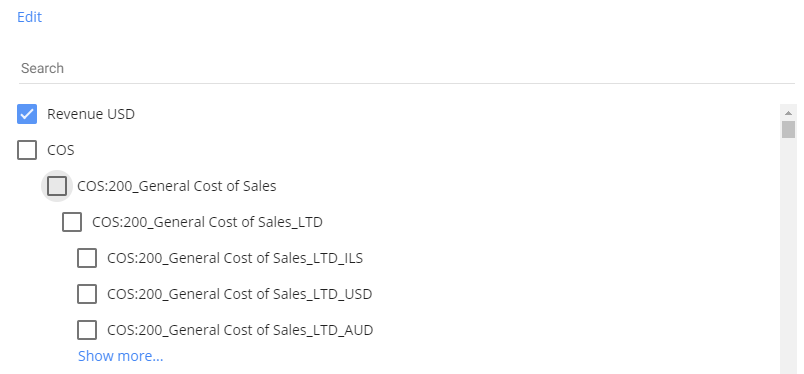
Select Accounts
- Click on Accounts to load the list of all available accounts.
- Click again to extend the list. Use the search bar for specific accounts.
- Select an account by checking the box next to it and click Save.
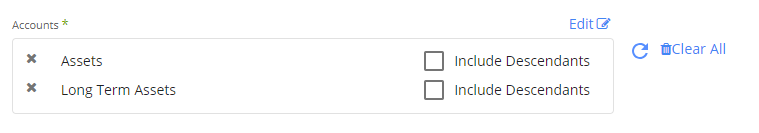
Include Descendants
- After saving your account selection, you can choose additional options by checking the Include Descendants box.
- This option includes direct descendants (e.g., selecting "assets" will include "current assets," "fixed assets," etc.).
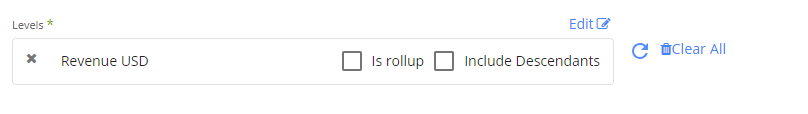
Select Levels
- Click on Levels to load the list of available levels.
- Select a level by checking the box next to it and click Save.
Include Levels and Roll-Ups
- Similar to account selection, you can include descendants by checking the Include Descendants box.
- Check Is Rollup to aggregate the results to that level.
Select Dimensions
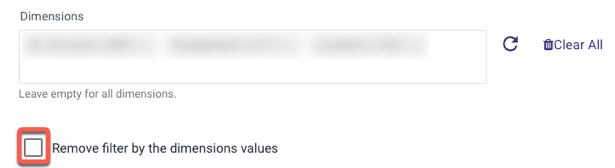
- Choose the dimensions that apply to your data. By default, the data will be filtered by the selected dimensions.
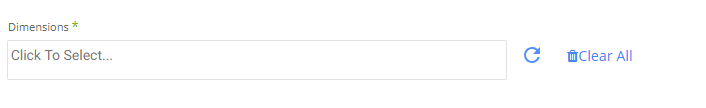
- To remove these filters and retrieve all data within the dimensions, check the box to disable the filters.
- Choose the dimensions that apply to your data. By default, the data will be filtered by the selected dimensions.
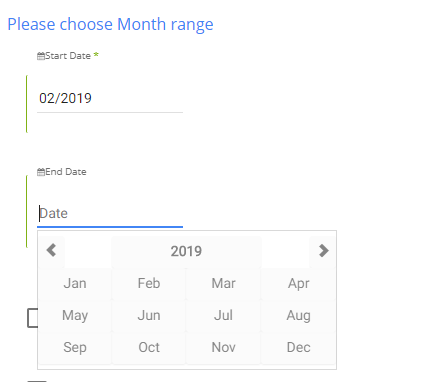
Date Range
- The date range for this report is month-based, allowing only the selection of months.
- If the end date is after the run date, the start date will be evaluated to the end date.
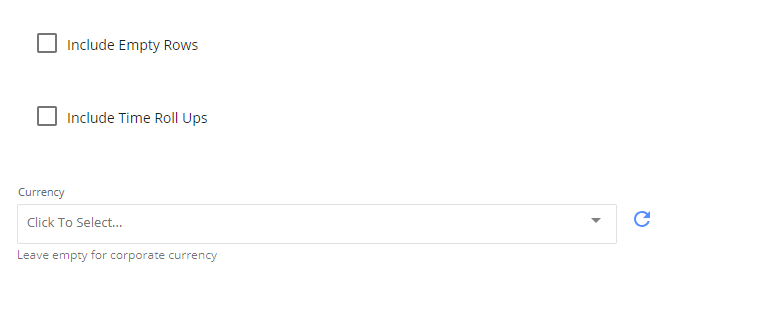
Additional Options
- Include Empty Rows: Check to retrieve rows without informative values.
- Include Time Roll-Ups: Check to aggregate results to a quarterly level (e.g., Q1 - 2019).
- Currency Selection: Override the default corporate currency by selecting a specific currency or leave it empty to use the default.
Was this article helpful?