- 1 Minute to read
- Print
- DarkLight
- PDF
Adobe Analytics Walkthrough
- 1 Minute to read
- Print
- DarkLight
- PDF
A Guide for getting data from Adobe Analytics to Rivery .
Prerequisites
An Adobe Analytics connection.
How to pull data from Adobe Analytics using Rivery
First, select 'Create New River ' from the top right of the Rivery screen.

Choose 'Data Source to Target' as your river type.
In the 'General Info' tab, name your river, describe it and choose a group.
Next, navigate to the 'Source' tab.
Find Adobe Analytics in the list of data sources and select it. (under Analytics )
Under Source Connection , select the connection you created, or create a new one.
Next, Select a type of report:
- Analytics - Adobe Analytics' API main feature. Build a report on your data.
- Users - Retrieves your Company's users data.
Analytics Report :
Choose a Report Suite.
Choose the metrics.
Choose dimensions. Leave empty to run the report without dimensions and get totals on the metrics for the chosen time range.
Selecting more dimensions (or dimensions with more elements) will cause longer run time for the report. Choosing too many dimensions may return an error stating that the report will take too long to execute.
Reports' Time Period:
Select the time period of the report:

The reports support two kinds of time period:
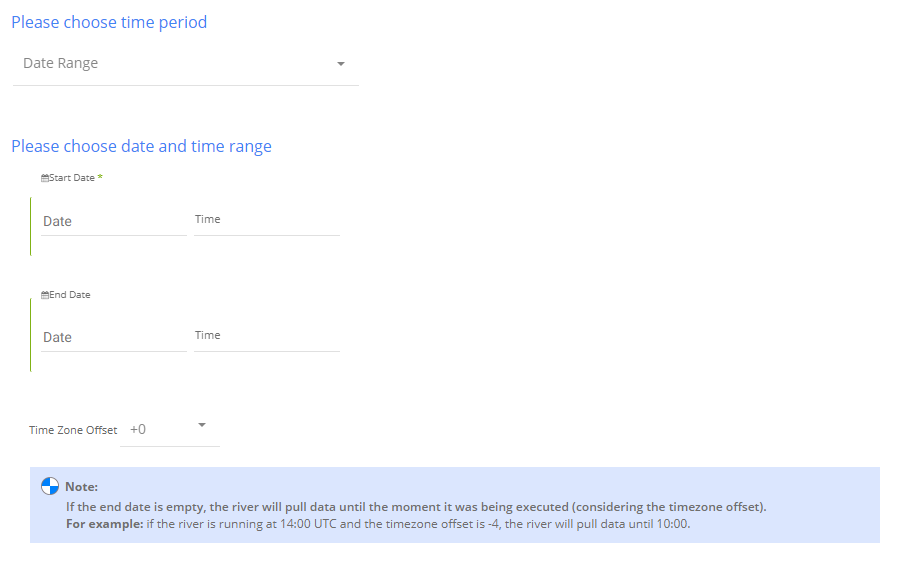
Date Range -
- Pulls data in the date range between the start and end date provided, including the end date.
- You must select a start date.
- Leaving the end date empty will pull data according to the current time of the river's run.
- Select a timezone offset to send dates considering the offset.
- Use the "Last Days Back For Each Run" to expend the start date and pull data a given amount of days back before the chosen start date.
Predefined date - A date range defined by Rivery:
- Day - Yesterday.
- Week (From Monday to Sunday) - Week to date, Previous week, Previous week to date.
- Month - Month to date, Previous month, Previous month to date.
- Year - Year to date.


