Skai Walkthrough
- 1 Minute to read
- Print
- DarkLight
- PDF
Skai Walkthrough
- 1 Minute to read
- Print
- DarkLight
- PDF
Article summary
Did you find this summary helpful?
Thank you for your feedback!
Pull data from Adquant in Rivery
Select the time period of the report
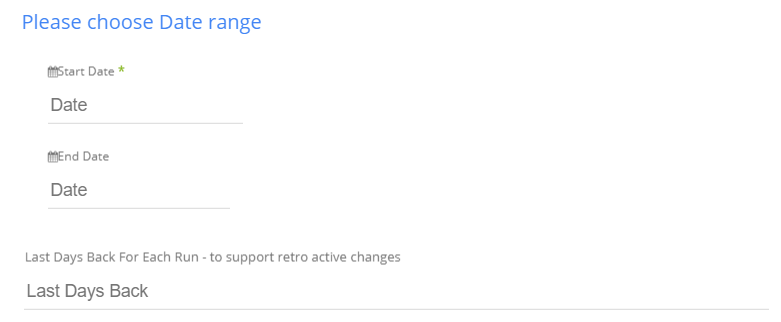
Insert any start date
Insert any end date - leave the end date empty in order to run the report up until the moment the river runs.
Days back - use that input in order to tell Rivery to pull data from a given amount of days back before the given start date.
Select the columns of the report:

Groups - select the dimensions of the report. Click to have a list of all the available dimensions.
Values - select the metrics of the report. Click to have a list of all the available metrics.
Filter by account:
Click to have a list of all available accounts.

Filter by product
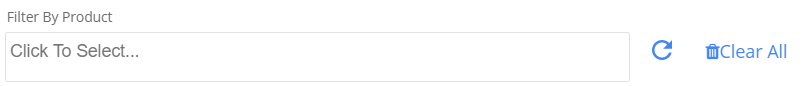
Click to have a list of all available products.
The products on the list are only products that were operated in the selected dates of the report. If there is no data for the product in the selected dates, it won’t be available in the list.
Facebook gender - Select the Facebook gender of the report

Currency - Select the currency of the report.

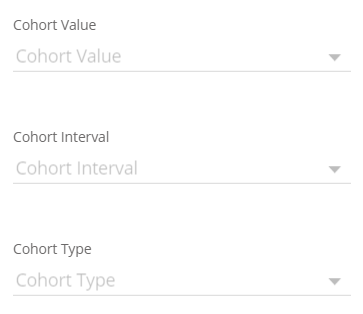
Cohort Details - Select the cohort type, cohort interval, and cohort value of the report.
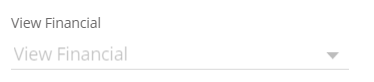
View Financial - select the financial view of the report.
Attribution Window - Insert any required attribution window of the report. Each attribution window will have its own columns in the results.

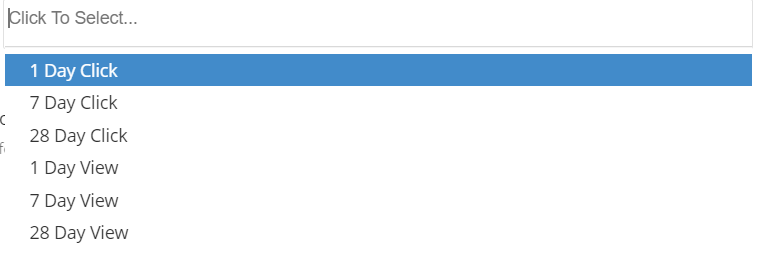
Action Period - Check that input in order to have attribution according to an action. Leave it for lifetime attribution.

Was this article helpful?