- 6 Minutes to read
- Print
- DarkLight
- PDF
Google Ad Manager Walkthrough
- 6 Minutes to read
- Print
- DarkLight
- PDF
Google Ad Manager API version 202405 is currently supported
Networks
Before you can run any kind of report you need to choose your network.

Click on the network refresh button and pick a network.
Reports
Rivery supports 3 kinds of reports:

Create a new report
Select dimensions:

Dimension provides the break-down and filterable types available for running a new report (report job). Aggregate and percentage columns will be calculated based on these groupings.
You can pick more than one dimension per report, but you must select at least one dimension for the report to be valid.
Not all combination of dimensions are valid and an error will be raised if an invalid combination is chosen.
Additional information regarding available dimensions and their UI representation is available in the "dimensions information" button.
Select dimension attributes

Dimensions attributes provides additional fields associated with a Dimension. It can only be selected with its corresponding Dimension. For example, DimensionAttribute.ORDER_PO_NUMBER can only be used if the ReportQuery.dimensions contains Dimension.ORDER_NAME.
This field is not mandatory.
Select custom fields

Custom Fields attributes can only be selected with their corresponding Dimension by their type. For example, a custom field with the 'ORDER' type can only be used if the 'Dimensions' input list contains Dimension.ORDER_NAME. Read here for more information.
Select columns

Column provides all the trafficking statistics and revenue information available for the chosen Dimension objects.
Columns with INVENTORY_LEVEL should not be used with dimensions relating to line items, orders, companies and creatives, such as Dimension.LINE_ITEM_NAME. Columns with LINE_ITEM_LEVEL can only be used if you have line item-level dynamic allocation enabled on your network.
You can pick more than one column per report, but you must select at least one column for the report to be valid.
Select ad unit view

A view for an ad unit report.
Defines how the metrics for ads will be shown and which events will be taken.
There are 3 options.
Top Level - Only the top level ad units. Metrics include events for their descendants that are not filtered out. (The top level ad will represent the metrics for it's descendants)
Flat - All the ad units. Metrics do not include events for the descendants.
Hierarchical - Use the ad unit hierarchy. There will be as many ad unit columns as levels of ad units in the generated report:
The column Dimension.AD_UNIT_NAME is replaced with columns "Ad unit 1", "Ad unit 2", ... "Ad unit n". If level is not applicable to a row, "N/A" is returned as the value.
The column Dimension.AD_UNIT_ID is replaced with columns "Ad unit ID 1", "Ad unit ID 2", ... "Ad unit ID n". If level is not applicable to a row, "N/A" is returned as the value.
Metrics do not include events for the descendants.
If no ad unit view is chosen the default is "Top Level".
This field is not mandatory.
Select report currency

The currency for Ad Exchange revenue metrics. This field is only valid for Ad Exchange metrics, and an exception will be thrown if this field is used with non-Ad Exchange metrics. Defaults to the network currency if left empty. The supported currency codes can be found in this supported currencies link.
This field is not mandatory.
Select time zone

The time zone used for the report.
There 3 available options:
Publisher - Use the publisher timezone. For Google Ad Manager reports, this time zone is compatible with all metrics. For Ad Exchange reports, this time zone is not compatible with "Bids" and "Deals" metrics.
Proposal Local - Use the proposal or proposal line item time zone. This time zone is only compatible with sales metrics and attributes.
Ad Exchange - Use the Ad Exchange time zone (Pacific Time Zone). This time zone is only compatible with Ad Exchange metrics.
Defaults to Publisher if left empty
This field is not mandatory.
Select time period

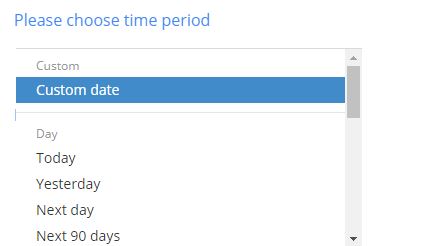
Report jobs support two kinds of the time period:
Custom date -
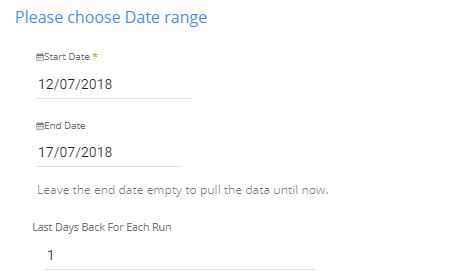
Pulls data in the date range between the start and end date provided.
You must select a start date.
Leaving the end date empty will pull data according to the current time of the river's run.
Use the "Last Days Back For Each Run" to expend the start date and pull data a given number of days back before the chosen start date.

In the example above the river will run with a date range between "11/07/2018" and "17/07/2018".
Predefined date- A date defined by the Google Ad Manager API, a few more complex examples are given below. A list of all available dates can be found in this link
- Reach lifetime - The last 63 days. This date range is only usable for the columns Column.REACH_FREQUENCY, Column.REACH_AVERAGE_REVENUE and Column.REACH.
- Last 3 months - The last 3 full months. For example, if today is May 5, 2017, then LAST_3_MONTHS would go from February 1 to April 30.
General notes regarding the report
- Creating a new report doesn't create a query and saves it but instead emulates the process behind the scenes by creating a report's job.
- The attributes for the report are shown as they are represented in the Google Ad Manager API, the links for each selection will provide additional information regarding the UI representations corresponding to these attributes.
- Not all combinations of dimensions, columns etc' are valid, an error will be raised if the combination chosen is invalid.
Run an existing report
An existing report is a predefined saved query in your Google Ad Manager console.
Select a predefined saved query

Click on the box or the refresh button to load all the saved queries from your console and select the one you wish to execute.
Some queries are incompatible for execution via the API, if a saved query isn't available for selection to try to make modifications to the query in your console until it is API compatible. Another option is to emulate that query in the "Create a new report" section.
Run an entity reports
Entities provide additional information on your Google Ad Manager activities. They are extracted using PQL (Publisher Query Language).
Rivery currently supports Line items entity.
Select an Entity

Select the desired entity.
Select the report fields

The fields represent the information you will receive on the entity.
This is a mandatory field, you can select more than one field.
Add conditions using the filter

The filter is an optional field which allows adding conditions to the Entity report.
Using PQL you could add more filtration to the Where clause of the Entity report.
Please note that the condition are appended using an "AND" command.
You can use any field you see in the Entity Fields as an addition filter.
For example: Id IN (34344, 23235)
Will filter all line items with the ids 34344 and 23235 for Line Items entity report,
In the chosen time range.
Another example:
LineItemType = 'Standard' and Status in ('Delivering', 'Ready') and NOT (Name LIKE '%Undertone%')
Will filter all line items with type 'standard' , which status is in 'Delivering' or 'Ready' and name doesn't contain 'Undertone'.
In the chosen time range.
Additional information on PQL can be found here
Select a time period
Entity reports supports two kinds of time period:
Date Range -
Pulls data in the date range between the start and end date provided.
You must select a start date.
Leaving the end date empty will pull data according the the current time of the river's run.
Select a timezone offset to send dates considering the offset.
Use the "Last Days Back For Each Run" to expend the start date and pull data a given number of days back before the chosen start date.

In the example above, the river will run with date range between "11/07/2018" and "17/07/2018".
Predefined date - A date range defined by Rivery:
- Day - Yesterday.
- Week (From Monday to Sunday) - Week to date, Previous week, Previous week to date.
- Month - Month to date, Previous month, Previous month to date.
- Year - Year to date.
Known UI differences
- To get revenue results compatible with the Google Ad Manager UI, you need to divide the revenue column by 1000000 in the column mapping stage
e.g.

under expression enter:
STRING(Column_AD_EXCHANGE_ESTIMATED_REVENUE / 1000000)

