ElasticSearch Walkthrough
- 3 Minutes to read
- Print
- DarkLight
- PDF
ElasticSearch Walkthrough
- 3 Minutes to read
- Print
- DarkLight
- PDF
Article summary
Did you find this summary helpful?
Thank you for your feedback!
Currently supported:
Point In Time API Version 7.10 and above
Mapping API Version 7.10 and above
Indices/Aliases API Version 7.10 and above
- Indices are the default option; if you want to use Aliases, please contact our support team.
This provides a general description of ElasticSearch and its capabilities.
Introduction
Elasticsearch is a distributed, RESTful search and analytics engine that can handle a wide range of scenarios. As the heart of the Elastic Stack, it saves your data centrally for lightning-fast search, fine-tuned relevancy, and scalable analytics.
Connection
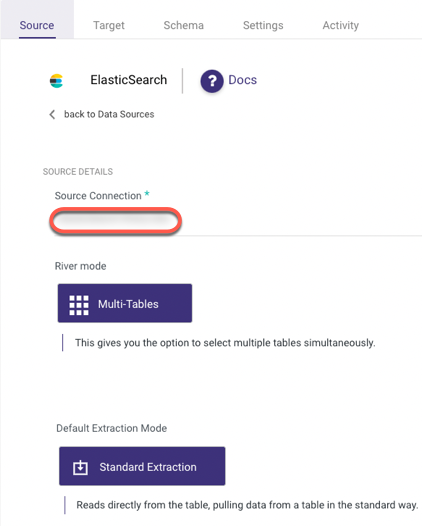
To connect to ElasticSearch , follow our step-by-step tutorial.
Now that you've established a connection, here are the features ElasticSearch offers for integrating data into a cloud target.
Pull ElasticSearch Data into a Target
ElasticSearch uses a Multi-Tables mode and a Standard Extractions Mode by default, allowing you to load multiple Indices/Aliases to your target at the same time.
Follow the steps below to pull ElasticSearch data into a target:
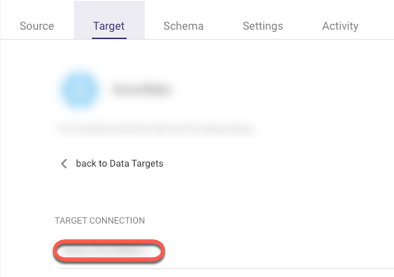
Set your Target:
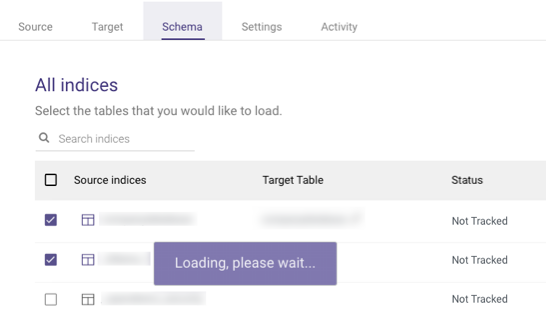
Click the Schema tab and wait for all Indices to load:
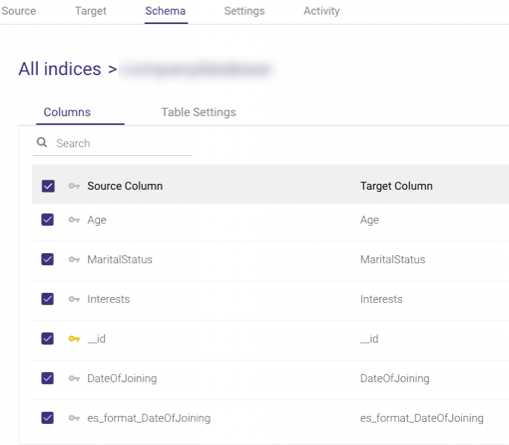
Select the index you desire, and the Document's Keys will appear:
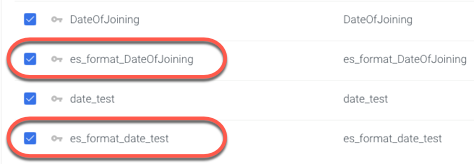
Note:
The fields below are typically used to preserve the format of the original 'date' and 'date nanos' fields, which are incompatible with some programming languages, while adding a new date field with the yyyy-MM-dd HH:mm:ss.SSS (Epoch time in milliseconds) format makes it possible.
These fields can be checked or left blank.
They have no effect on your data if you check them, but they do create a new date field format to each 'date' and 'date nanos' field if you do.
Each new field is prefixed with 'es_format_' and saved in the table.
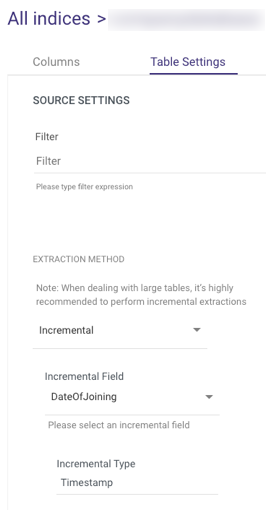
- Select Table Settings:
Please Note:
The Filter field in the Table Settings tab can be filled in with the same query that you use in Elastic's Dev Tools to filter the search results.
A single Object or an Array can be used as the filter.
Here are some examples:
Object -
This identifies the document's 'Status' field, which contains the 'Published' parameter.{ "term": { "status": "published" }}Array -
This retrieves all documents with the 'Status' field containing the 'Published' parameter after the specified date.{ "term": { "status": "published" }}, { "range": { "publish_date": { "gte": "2015-01-01" }}}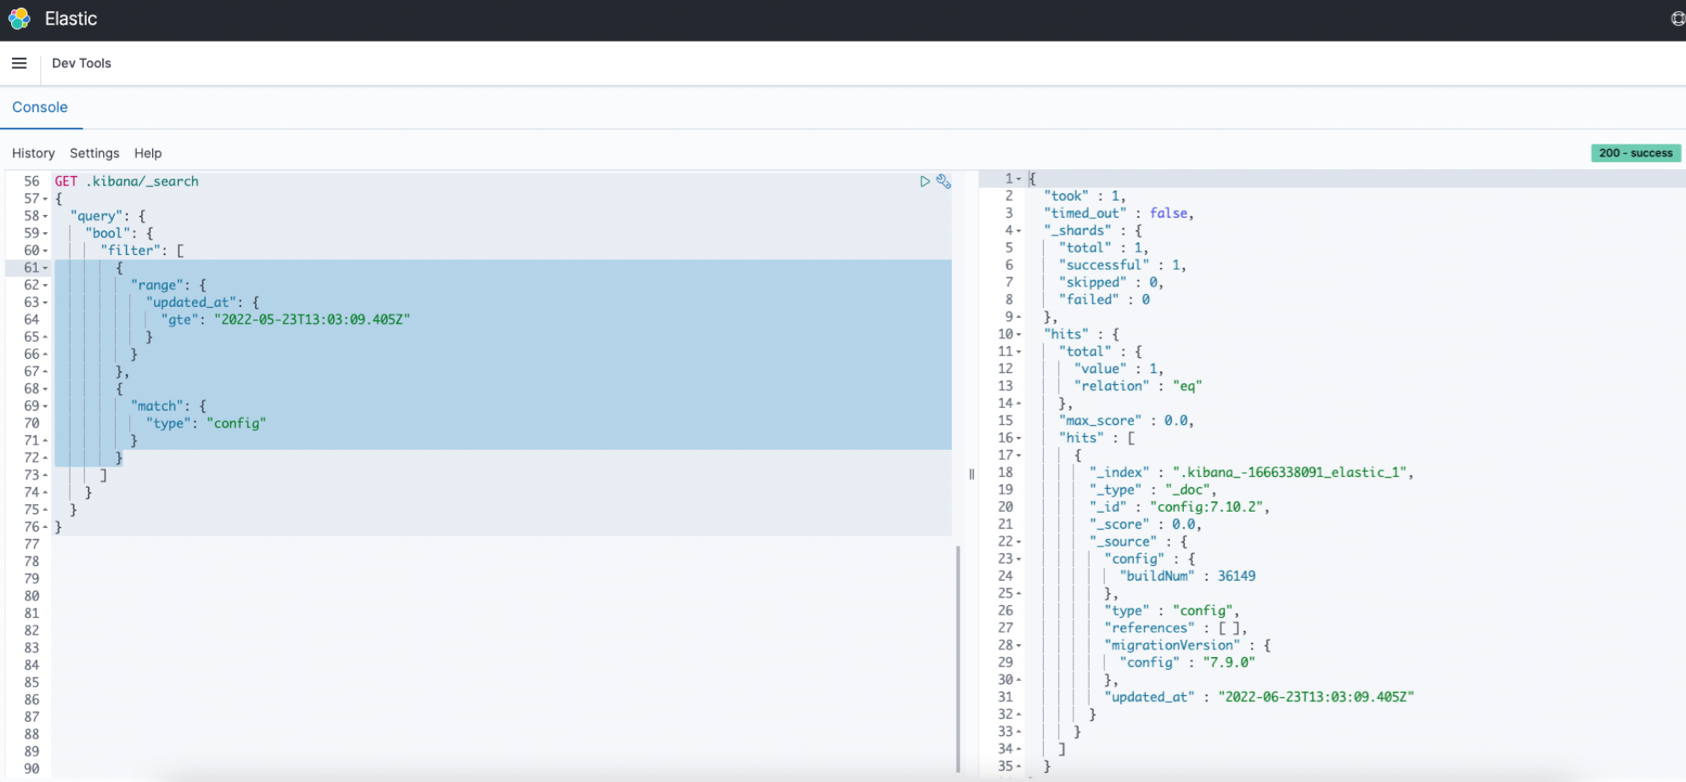
Please ensure that you copy the query under the Filter without the square brackets.
- The default output format for Date Fields is yyyy-MM-dd HH:mm:ss.SSS.
- You can extract data in two ways:
- All (Default)
- Incremental
- Choose 'All' to retrieve all data regardless of time periods or select 'Incremental' to control the date range of your report. Only 'Date' and 'Date Nanos' would be received in Incremental fields.
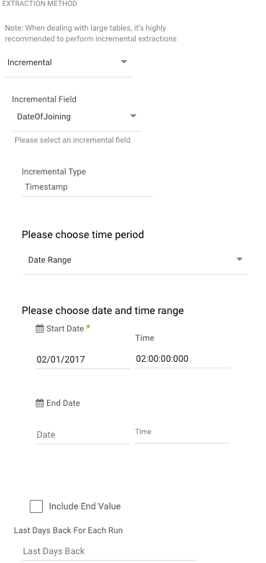
Note:
- Start Date is mandatory.
- Data can be retrieved for the date range specified between the start and end dates.
- If you leave the end date blank, the data will be pulled at the current time of the river's run.
- Dates timezone : UTC time.
- Use the Last Days Back For Each Run option to gather data from a specified number of days prior to the selected start date.
Limitations
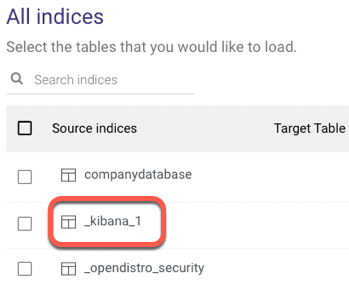
- Periods are automatically replaced with underscores.
If more than one index matches, these Indices are skipped and not included in the River.
Consider the following scenario -
if the original Indices are as follows:
.Kibana_1
_Kibana.1
They'll both be automatically converted to _Kibana_1, and the River won't be able to tell the difference, therefore they're not included to avoid data discrepancy.
- The default feching page size from Elastic is 10,000.
Please keep in mind that this is dependent on the CPU/memory of the elastic nodes, which means that if the volume of data (documents) is substantial and the CPU/memory of the elastic node's resources are limited, a request for more than 100 per page size will fail.
This issue would be visible in the logs, so please consult them if you suspect this is the problem and contact our support team.
Was this article helpful?