Google Ads Walkthrough
- 4 Minutes to read
- Print
- DarkLight
- PDF
Google Ads Walkthrough
- 4 Minutes to read
- Print
- DarkLight
- PDF
Article summary
Did you find this summary helpful?
Thank you for your feedback!
Google Ads API version 17 is currently supported.
Introduction
Google Ads helps businesses reach potential customers. Rivery consolidates data from various sources into a centralized data warehouse. Integrating Google Ads with Rivery streamlines data management and enhances marketing analytics.
Connection
To connect Google Ads with your destination, follow our step-by-step tutorial.
Choose a Source connection after you've created a connection, as seen here:
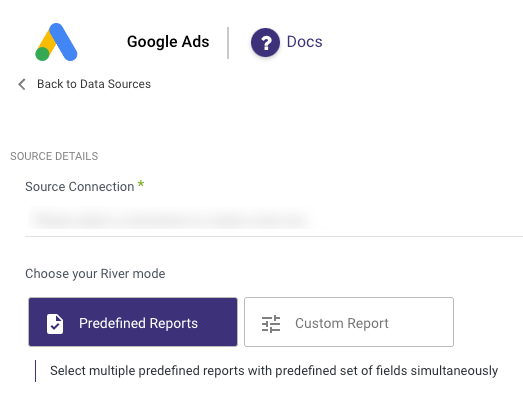
Predefined Reports
Rivery provides a convenient entry point and recommended approach for accessing a range of predefined reports for your use. Each report includes a concise data description, a list of customizable fields (if applicable), and the schema mapping.
Since these reports follow a standardized format, specific fields are restricted and can only be accessed through Custom Reports.
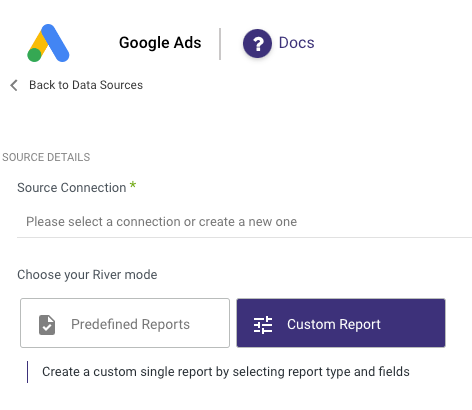
Custom Reports
Select a specific report to pull data from the Google Ads.
The following image provides an overview of the various custom reports:
Google Ads Custom Reports can be executed in one of the following options:
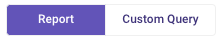
Create a Report
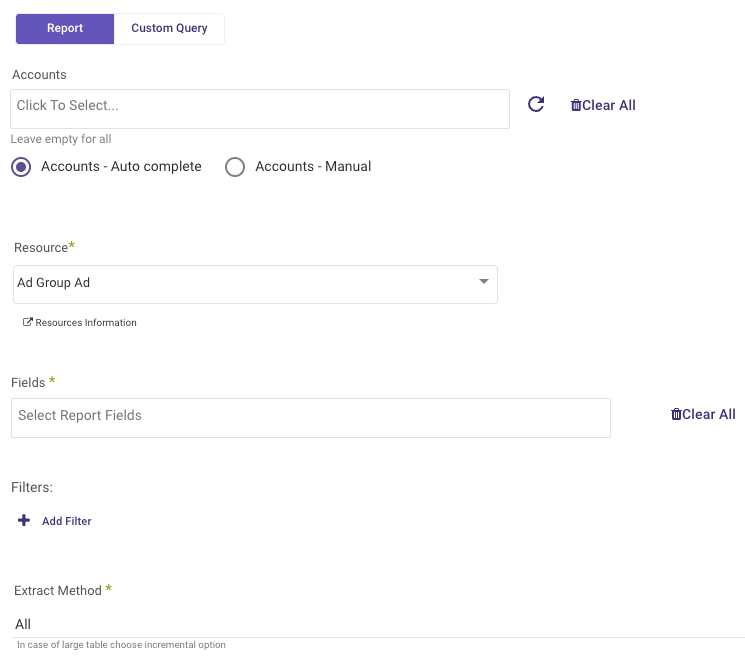
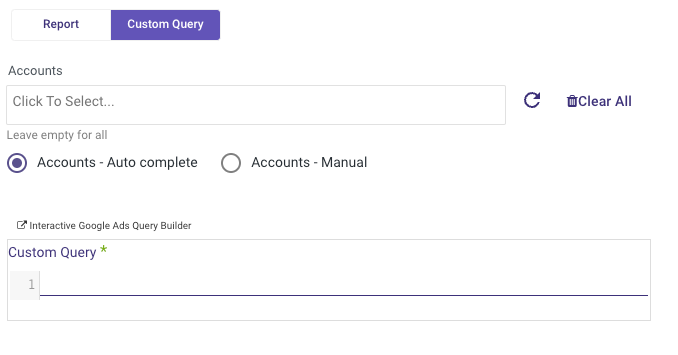
Accounts : clicking the 'Accounts' input will show up a list of all the accessible customers that you permissions to pull data in your Google Ads account. You may select one or more accounts, or leave empty to pull data for all accounts.
you have 2 option to choose from:
Accounts - Auto Complete: pulling function for the connection you inserted
Accounts - Manual - you know exactly type which account to pull data, this takes less time
Resource : Select a report from the list of reports.
- For more information on the available reports and their attributes and metrics click here.
- For Migrating reports from Google Adwords click here
Fields : Select fields for the selected report. Please note that selecting some fields may disable other fields that cannot be selected together.
Please Note:
'Performance Max' details are only available in Campaign reports, not Ads reports. To retrieve these details, select Campaign reports and include metrics like campaign.advertising_channel_type, segments.date, and campaign_id.
Once the River is run, you can find the Performance Max details in the campaign.advertising_channel_type column.
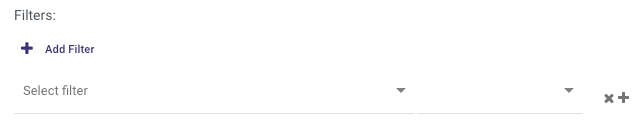
Filters: Data is filtered by the selected filters. To add filters, click on the 'add filters' button, and select a filter name, operator and value for each filter. You may add the same filter more than once, with different values and operators if necessary.
- Selecting 'IN' or 'NOT IN' operators enables inserting multiple values in 'Filter Value' field.
- Selecting 'date' type segments fields in 'Fields' requires adding filters for these fields.
Extract Method: Selecting 'All ' if the report should not be incremental or if there is no segment field with 'date' type in the selected fields.
Selecting the 'Incremental ' method requires selecting an incremental field and selecting the time period to run on.
Please note that only reports that have 'date' type fields can be incrementally extracted.
Time Period for Incremental Loading
Select the time period of the report:
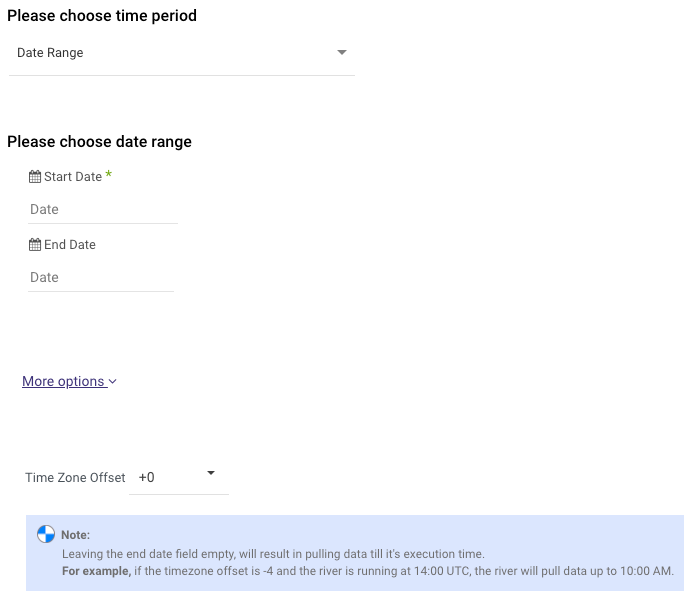
The Google Ads reports support two kinds of time period increments:
Date Range -
- Pulls data in the date range between the start and end date provided, including the end date.
- A Start Date is required
- Leaving the end date empty will pull data according to the current time of the river's run.
- Select a timezone offset to send dates considering the offset.
- Use the "Last Days Back For Each Run" to expand the start date and pull data a given number of days back before the chosen start date.
Predefined date - Canned date ranges
- Day - Yesterday.
- Week (From Monday to Sunday) - Week to date, Previous week, Previous week to date.
- Month - Month to date, Previous month, Previous month to date.
- Year - Year to date.
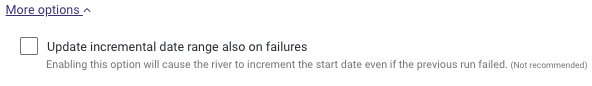
The Start Date will not advance if a River run is unsuccessful. To change this default setting, click More Options and check the box to advance the start date even if the River run is unsuccessful.
Interval Chunks
Rivery can run over the increment using chunks, in order to make the loading more efficient and more precise. The chunking options are:
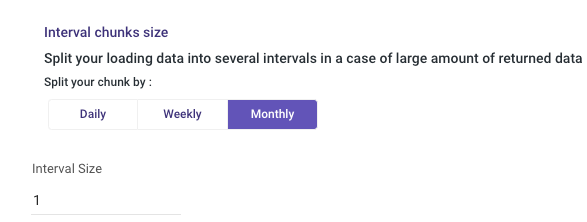
Don't Split - Rivery will pull the data from the chosen start date to the end date in one bulk.
Daily - The run will be chunked daily from the start to the end date.
Monthly - The run will be chunked monthly from the start to the end date.
Yearly (Less Recommended) - The run will be chunked yearly from the start to the end date.
Running a Custom Query
This mode allows for query pulls generated in the interactive Google Ads Query Builder.
Please note that running a custom query can not be incremental as in the 'Report' mode. Instead, build a time filter using the Query Builder linked above.
Activity Logs
The Activity Logs offer an inside perspective of the processes taking place in Google Ads River.
The Difference Between Clicks and Sessions
Some rows in Google Ads reports have no session data. A common reason for missing data is that a Google Ads account is linked to a view for which some traffic has been filtered out. For example, if traffic to a specific landing page has been filtered out of a view, the Google Ads information for those destination URLs is still pulled, but not basic metrics like Sessions and Bounce Rate. Click to learn more about the distinctions between a click and a session.
Troubleshooting HTTP Error Code 403: “Permission Denied”
The HTTP Error Code 403 with the message "Permission Denied" indicates that access to the requested Google Ads resource is restricted. To resolve this issue, follow these steps:
1. Log In to Your Google Ads Account
- Ensure you are signed in to the correct Google Ads account.
2. Verify Account Status
- Navigate to your Google Ads account dashboard.
- Confirm that the account status is set to Active.
By ensuring your account is active and properly configured, you can eliminate common causes of the 403 "Permission Denied" error.
Was this article helpful?