- 3 Minutes to read
- Print
- DarkLight
- PDF
Moat Analytics Walkthorugh
- 3 Minutes to read
- Print
- DarkLight
- PDF
Introduction
This document provides step-by-step instructions for integrating Moat Analytics, a digital advertising analytics and measurement platform.
Connection
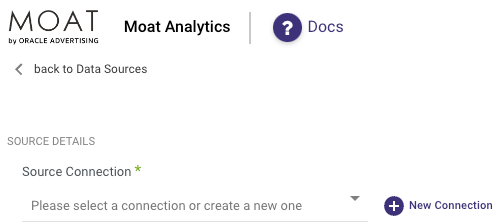
To connect Moat Analytics with your destination, follow our step-by-step tutorial.
Choose a Source connection after you've created a connection, as seen here:

Moat Analytics Options and Settings in Rivery
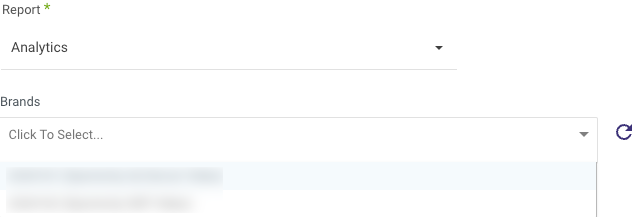
The integration between Rivery and Moat allows for data retrieval using Moat's Analytics report. The available options and settings in Rivery are determined by the features provided by Moat's reporting services.
Please Note:
Moat does not offer dynamic entities and fields fetching. Consequently, some settings need to be configured manually. To check the available brands, fields, and grouping options, please refer to the Moat Analytics documentation and enter your token in the appropriate format.
Brands
From the Brands field, choose the specific brand from which you want to fetch data. This selection determines the data source for the report.

Report Columns
Choose the desired report columns to include in your data fetch. The columns section provides a list of metrics that can be included in the report. Select the appropriate columns based on your reporting requirements.

Field Aliases
Moat allows aliasing of report column names. By enabling the "Include Field Aliases" option, any chosen report column field with aliases (previous names) will be added to the target schema mapping with the same values.
This means that both the new field name and the old field name will be included as target table columns with their corresponding values in the results.
For example, if a selected report column field is named "new_field_name" with a value of 1, and it has an old name "old_field_name," both "new_field_name" and "old_field_name" will be added as target table columns with a value of 1 in the results.

Predefined Filters
Predefined filters can be applied to the report to restrict the data returned in the response. Moat Analytics provides several filter options that are divided into the following sections:
- Levels: Add filters based on the selected Brand Levels Values.
- Slicers: Add filters based on the selected Brand Slicers Values.
- Include OS Browser: Add an OS Browser filter to include or exclude specific browsers. Enabling this option will filter the data based on the selected OS Browser, and an "os_browser" report column will be added.
Please Note:
Adding Levels, Slicers, and the OS Browser filters to the report columns will act as a group-by function (roll-up) and may change the granularity and structure of the results.
Free Text Filters
In addition to the predefined filters, Rivery also supports free text filters based on the Moat report capabilities.
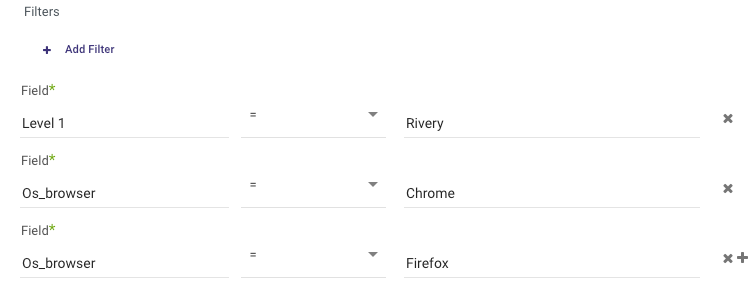
To add a filter, select the "+ Add Filter" option, choose the desired dimension for filtering, and specify the corresponding value. If multiple filters are applied within the same column, they are considered as options joined by "OR". On the other hand, when multiple filters are used across different columns, they are combined using "AND".
For instance, if you want to retrieve the campaign labeled "Rivery Vikings" exclusively for Chrome and Firefox OS Browsers, you should apply the following filter:

Set the Time Period
Rivery effectively handles data updates for the Rivers and employs optimal techniques to retrieve incremental data from the source, in accordance with the source's recommended practices.
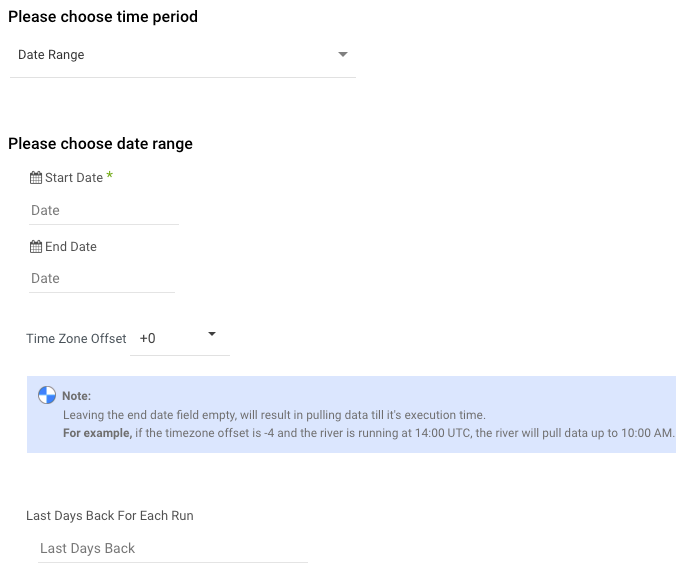
When opting for the "Date Range" feature, please take note of the following:
- Start Date is mandatory.
- Data can be retrieved for the date range specified between the start and end dates.
- If you leave the end date blank, the data will be pulled at the current time of the river's run.
- Dates timezone: UTC time.
- Use the Last Days Back For Each Run option to gather data from a specified number of days prior to the selected start date.

Rivery interpretes the date_grouping key as "day", resulting in each row of data in the Target representing a single day.

