Snapchat Marketing Walkthrough
- 4 Minutes to read
- Print
- DarkLight
- PDF
Snapchat Marketing Walkthrough
- 4 Minutes to read
- Print
- DarkLight
- PDF
Article summary
Did you find this summary helpful?
Thank you for your feedback!
Introduction
This integration empowers marketers to seamlessly gather, centralize, and analyze Snapchat campaign data alongside other marketing data sources. By leveraging Rivery's features, marketers can optimize their Snapchat marketing strategies, track campaign performance, and derive actionable insights to drive business growth effectively.
Connection
To connect Snapchat Marketing with your destination, follow our step-by-step tutorial.
Choose a Source connection after you've created a connection, as seen here:
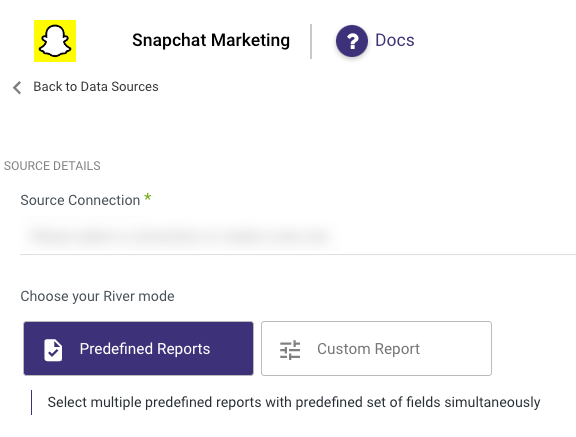
Predefined Reports
Rivery provides a convenient entry point and recommended approach for accessing a range of predefined reports for your use. Each report includes a concise data description, a list of customizable fields (if applicable), and the schema mapping.
Since these reports follow a standardized format, specific fields are restricted and can only be accessed through Custom Reports.
Custom Reports
Select a specific report to pull data from the Snapchat Marketing.
The following image provides an overview of the various custom reports:
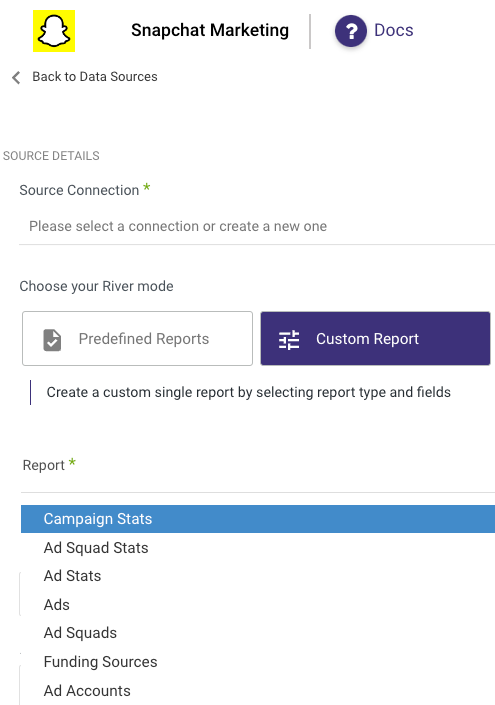
There are several reports which can roughly split into stats reports denoted with "stats" as a suffix and non stats reports.
Start to build the Snapchat data integration river by selecting the report you wish to pull.
- Ad Accounts
- Ad Squad Stats
- Ad Squads
- Ad Stats
- Ads
- Audience Filters
- Campaign Stats
- Campaigns
- Creative
- Funding Sources
- Media
- Organizations
Stats reports
- There are 3 stats reports available: "Campaign", "Ad Squad" and "Ads".
- The campaign stats report has the highest granularity, while the ads is the lowest. The ads stats report also has the most possible configurations so we will focus on this report.
- Select the report
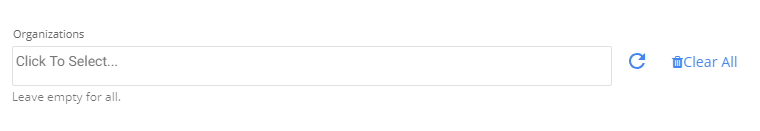
- Select the required organizations or leave the input box empty to pull from all organizations. An organization is the highest entity in Snapchat which represents a partner, ad agency, or a brand.
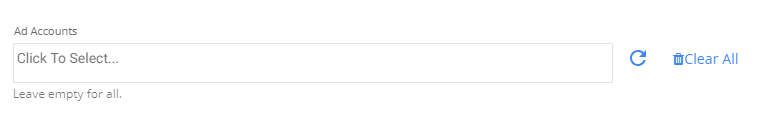
- Select the required ad account or leave the input box empty to pull all ad accounts.
An Ad Account is owned by an Organization and contains Ad Campaigns
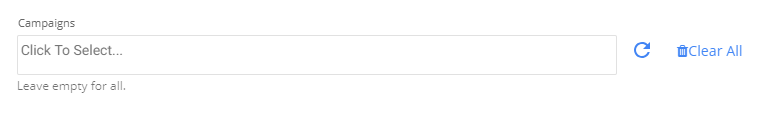
- Select the required campaign or leave the input box empty to pull all campaigns.
A campaign has a business objective and organizes Ad Squads
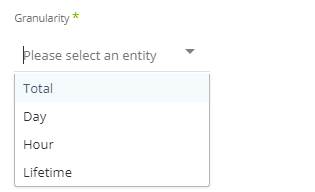
- Pick the desired granularity
The metrics will return according to the chosen granularity. Day and Hour granularity requires to choose a date range, while Total and Lifetime don't.
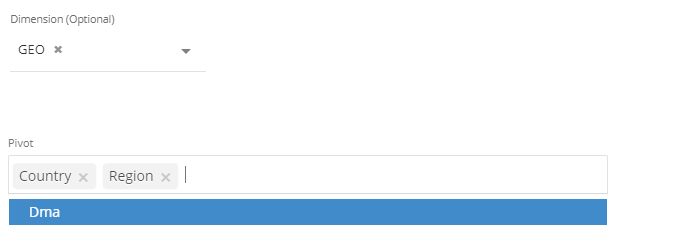
- Optionally, you can select a dimension and a pivot.
Reporting insights can return base on dimension.
If you select a dimension, an additional input box named pivot will appear.
Data within a dimension can be broken down by the additional pivots selected.
Do note that the list of supported fields(metrics) is considerably shorter than the default list.
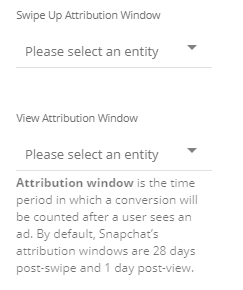
- Select attribution windows.
Attribution window is the time period in which a conversion will be counted after a user sees an ad. By default the attribution windows are 28 days post-swipe and 1 day post-view.
Not all combination of attributions windows are allowed, in the table below you will find the allowed combinations:
| View window | Swipe window 1_DAY | Swipe window 7_DAY | Swipe window 28_DAY |
|---|---|---|---|
| 1_HOUR | Allowed | Allowed | Allowed |
| 3_HOUR | Allowed | Allowed | Allowed |
| 6_HOUR | Allowed | Allowed | Allowed |
| 1_DAY | Allowed | Allowed | Allowed |
| 7_DAY | Not Allowed | Allowed | Allowed |
| 28_DAY | Not Allowed | Not Allowed | Allowed |
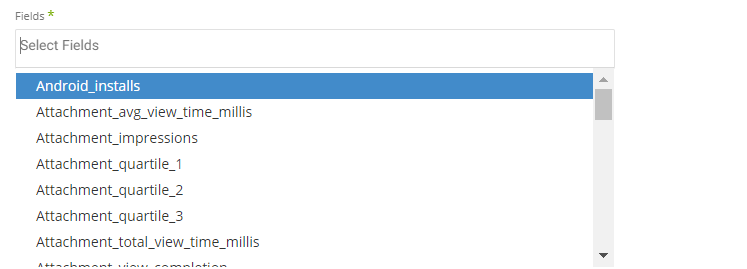
- Select the fields(metrics).
- Select the time period. This is only relevant for Day or Hour granularity.
- Select the type of time period of the report.
It can be a custom date range (as described in the picture above) or a defined time period shown in the pop up list (for example Yesterday, last week etc.)
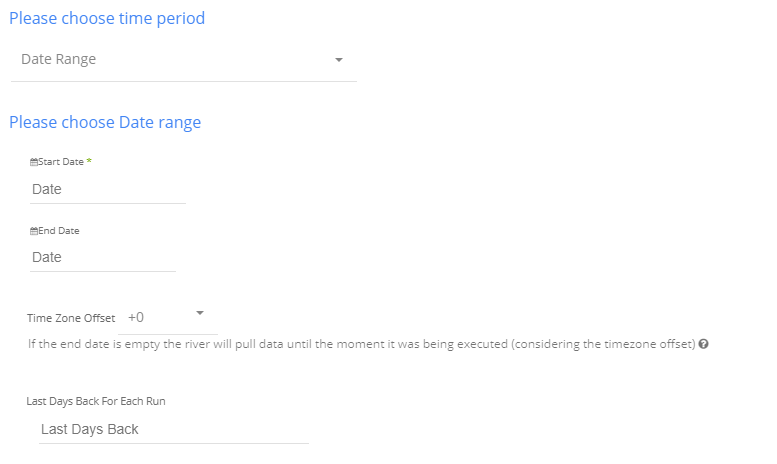
Instructions if selecting ‘Date Range’:
- Select the start date and end date.
- Leave the end date empty in order to pull data until the moment
- the river runs.
- After each run of the river, the start date will be updated automatically with the end date, and the end date will be updated with the empty value. This enables the next run to pull data from the end of the previous run.
- Select the time zone offset. It will be relevant only if the end date is empty in order to find the moment of the river’s run according to the time zone.
- Days back - use this input to tell Rivery to pull data from a given number of days back before the given start date.
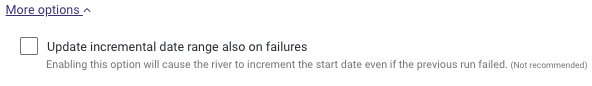
- The Start Date won't be advanced if a River run is unsuccessful.
If you don't want this default setting, click More Options and check the box to advance the start date even if the River run is unsuccessful (Not recommended).
Instructions if selecting any other value:
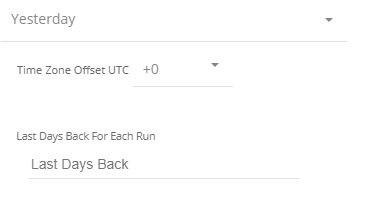
Select the timezone offset in order to send the correct dates that consider that offset.
Non stats reports
Generally speaking, non stats reports are quite simple and require far fewer configurations than stats reports. Depending on the report, usually these there entities are optional: organizations, ad accounts, and campaigns.
Non stats reports example - Ad report
The ad reports pulls information regarding ads.
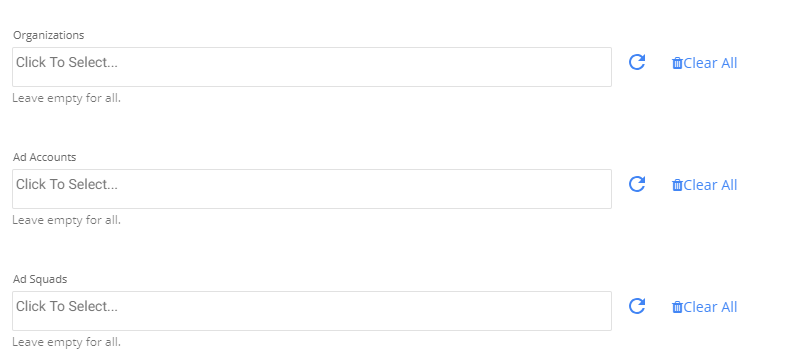
- The report has 3 options: organizations, ad accounts, and ad squads.
- Leaving all the options empty will pull data from all organizations, ad accounts, and ad squads.
- To filter specific ad accounts or ad squads, you need to fetch the list of desired entity and select the required entities.
Rate Limit
Rate limits are put in place by the Snapchat Marketing API to maintain the stability of its infrastructure.
These limits operate on 2 levels: the App and Token levels.
The App itself can handle an average of 20 requests per second, while individual Access tokens issued by the App are limited to an average of 10 requests per second.
When the rate limit is reached, you'll encounter an HTTP 429 Too Many Requests response.
If your application consistently triggers HTTP 429 errors, you must reduce the rate at which your App sends requests to the API.
Was this article helpful?