- 2 Minutes to read
- Print
- DarkLight
- PDF
Taboola Walkthrogh
- 2 Minutes to read
- Print
- DarkLight
- PDF
Taboola API version 1 is currently supported
Introduction
Taboola is a content discovery and native advertising platform that helps publishers monetize their websites by recommending sponsored content and allows advertisers to promote content across a network of premium publishers. Key features include personalized content recommendations, native ads, advanced targeting, and detailed performance analytics.
Integrating Taboola with Rivery enables automated data pipelines, custom data transformations, and centralized reporting. This integration helps businesses efficiently analyze Taboola data alongside other data sources for comprehensive insights and improved decision-making.
Connection
To connectTaboolaKlaviyo API v2024-02-15 API with your destination, follow our step-by-step tutorial.
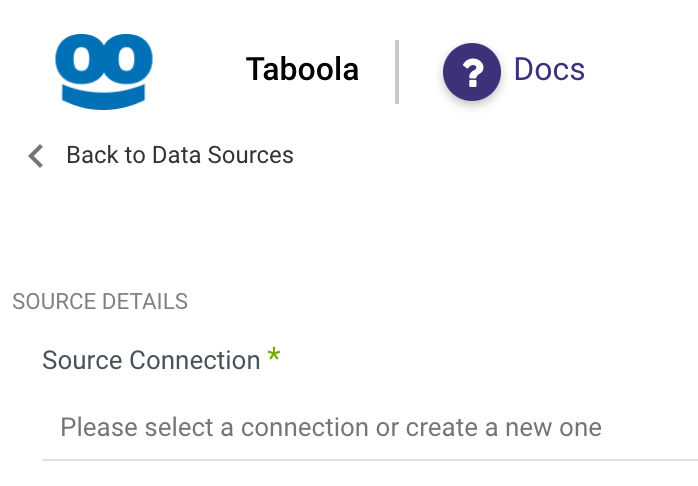
Choose a Source connection after you've created a connection, as seen here:

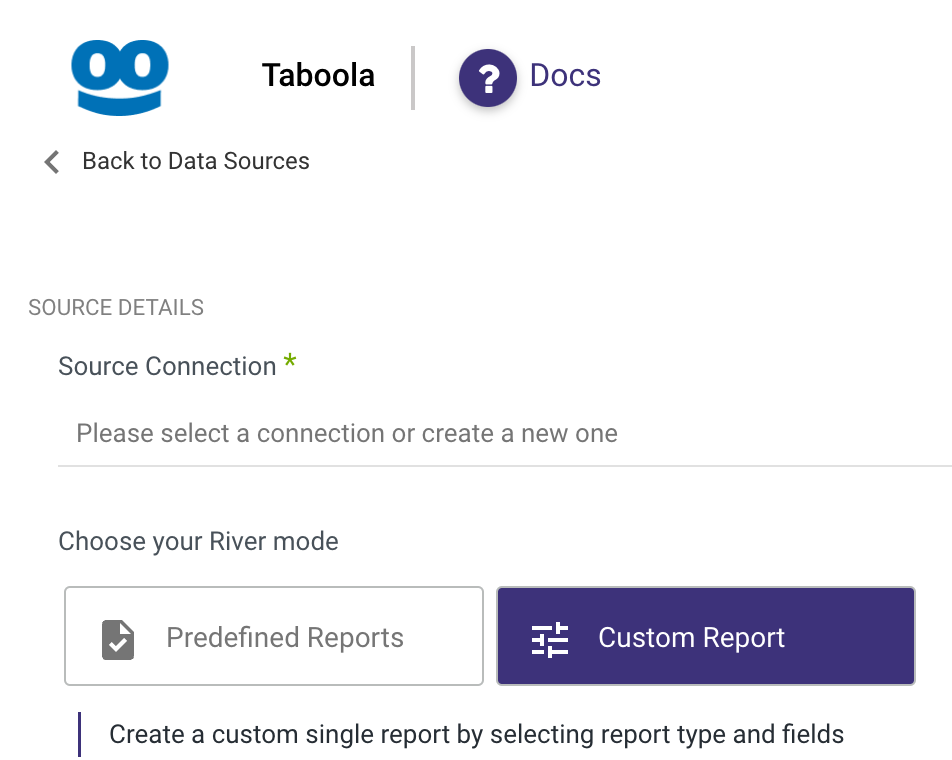
Predefined Reports
Rivery provides a convenient entry point and recommended approach for accessing a range of predefined reports for your use. Each report includes a concise data description, a list of customizable fields (if applicable), and the schema mapping.
Since these reports follow a standardized format, specific fields are restricted and can only be accessed through Custom Reports.
Custom Reports
Select a specific report to pull data from the Klaviyo API v2024-02-15 API.
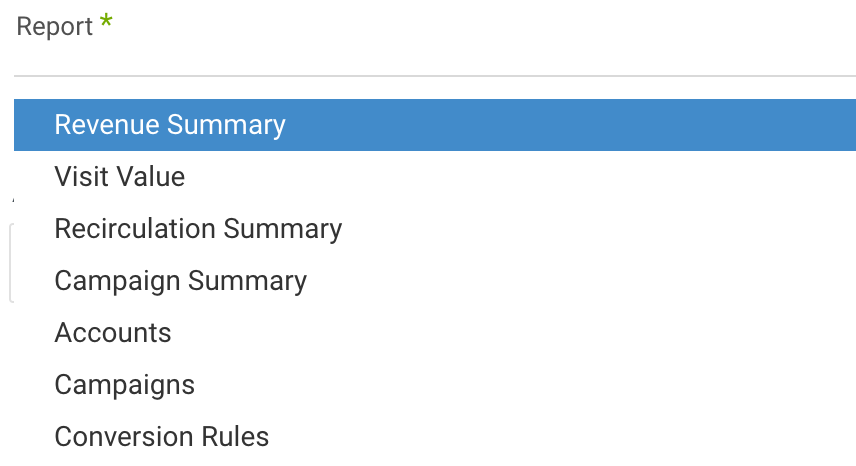
The following section provides an overview of the various custom reports:
- Revenue Summary
- Visit Value
- Recirculation Summary
- Campaign Summary
- Accounts
- Campaigns
- Conversation Rules
- Top Campaign Content
- Video Campaign Summary

Reports in Rivery can be found in the report input, each report has its own related inputs.
 Note: For each report in Rivery, you can see whether it is an Advertiser Report or Publisher Report.
1. Select the accounts of the report. Leave this input empty to pull the results for all the available accounts.
2. Select which dimension to pull.
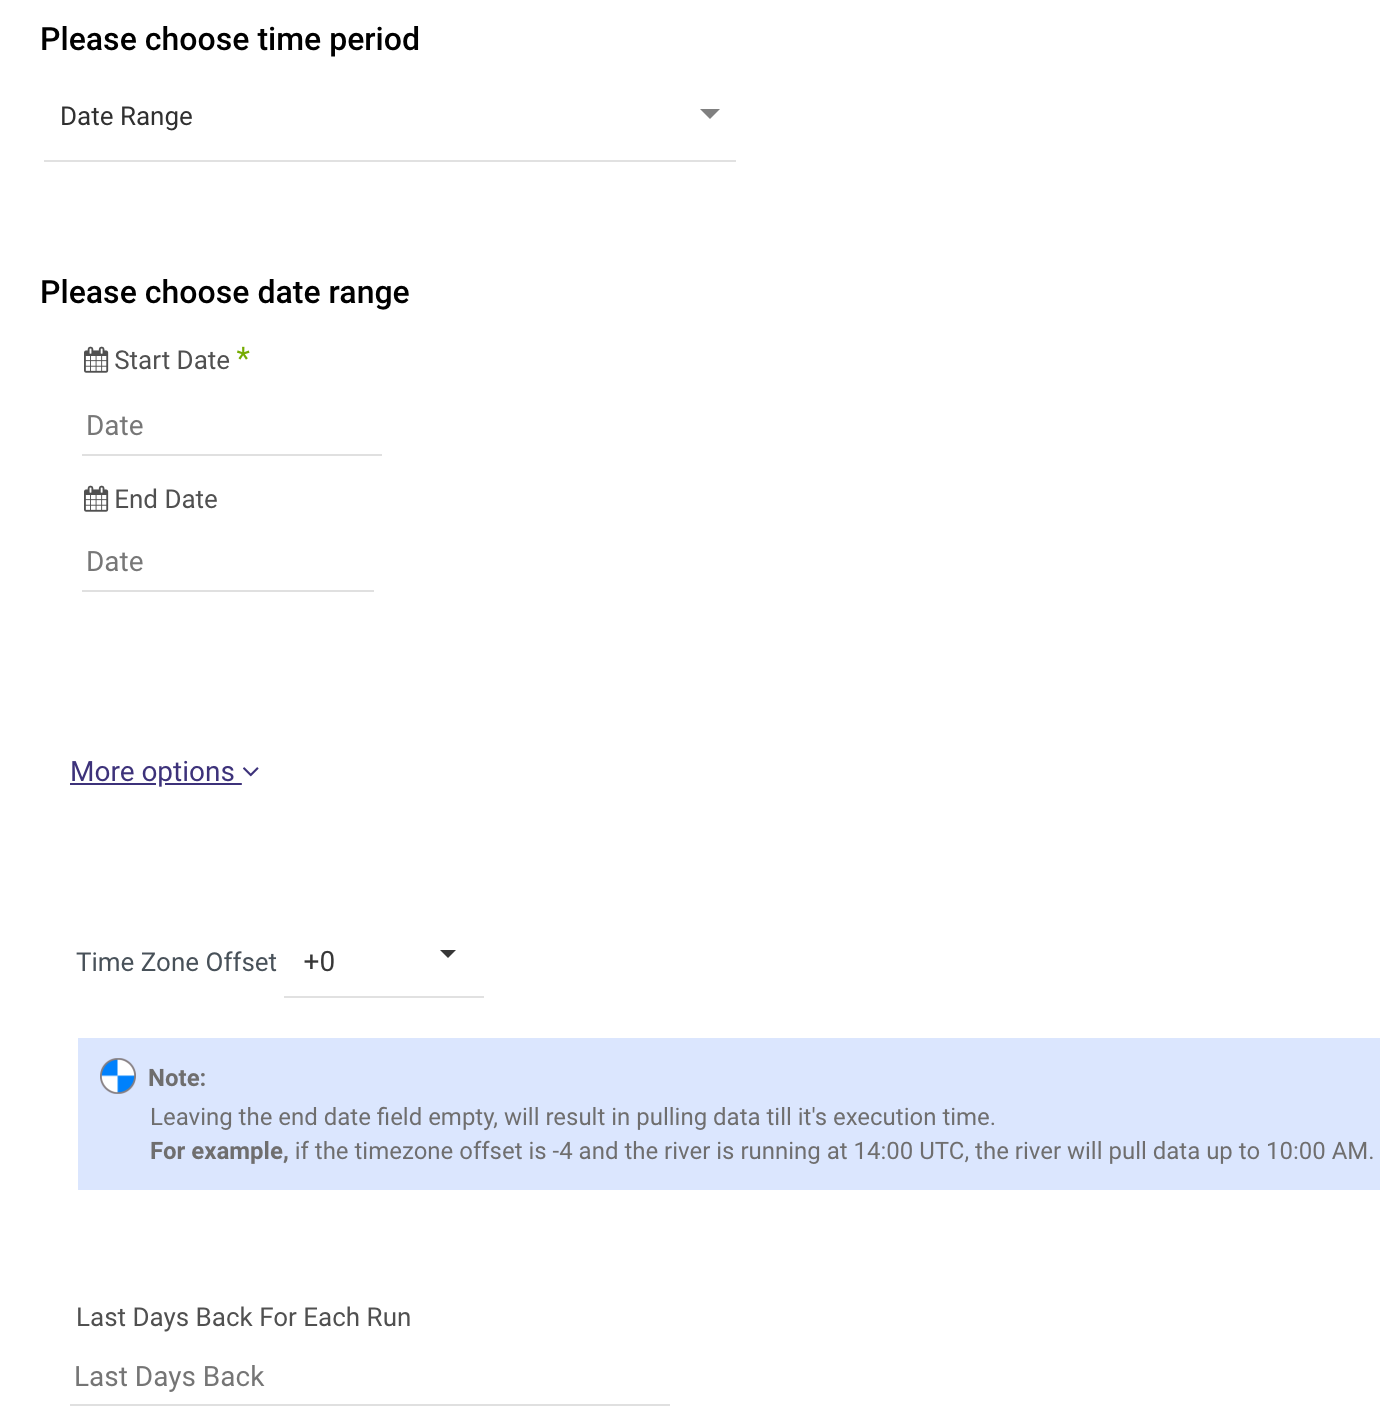
3. Part of the reports support two kinds of the time period:

Date Range -
- Pulls data in the date range between the start and end date provided, including the end date.
- You must select a Start Date.
- The Start Date won't be advanced if a River run is unsuccessful.
If you don't want this default setting, click More Options and check the box to advance the start date even if the River run is unsuccessful (Not recommended).

- Leaving the End Date empty will pull data according to the current time of the river's run.
- Select a timezone offset to send dates considering the offset.
- Use the "Last Days Back For Each Run" to expend the start date and pull data a given number of days back before the chosen start date.
Predefined date - A date range defined by Rivery:
- Day - Yesterday.
- Week (From Monday to Sunday) - Week to date, Previous week, Previous week to date.
- Month - Month to date, Previous month, Previous month to date.
- Year - Year to date.
Interval Chunks - Rivery can run over the increment using chunks, in order to make the loading more efficient and more precise. You can choose from:

Don't Split - Rivery will pull the data from the chosen start date to the end date in one bulk.
Daily - The run will be chunked daily from the start to the end date.
Monthly - The run will be chunked monthly from the start to the end date.
Yearly (Less Recommended) - The run will be chunked yearly from the start to the end date.

