MixPanel Walkthrough
- 8 Minutes to read
- Print
- DarkLight
- PDF
MixPanel Walkthrough
- 8 Minutes to read
- Print
- DarkLight
- PDF
Article summary
Did you find this summary helpful?
Thank you for your feedback!
Introduction
This document provides an overview and step-by-step guide for integrating Mixpanel, a powerful analytics platform, into your web or mobile application. Mixpanel offers advanced user behavior tracking, event analysis, and user segmentation, enabling businesses to gain valuable insights into user interactions and optimize their products or services. This document outlines the essential concepts, integration process, and key considerations to successfully incorporate Mixpanel analytics into your application, enhancing your data-driven decision-making capabilities.
Connection
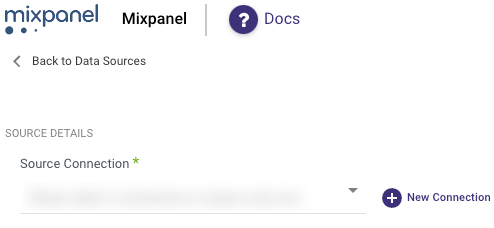
To connect Mixpanel with your destination, follow our step-by-step tutorial.
Choose a Source connection after you've created a connection, as seen here:
Mixpanel Reports in Rivery
Rivery offers access to the reports found within the Mixpanel reporting dashboard.
Begin constructing your Mixpanel River by choosing the Mixpanel report from the list of reports:
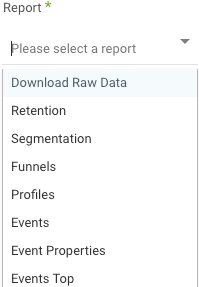
Download Raw Data
The Download Raw Data report captures every event within the specified time period for the designated event type. Since this report accommodates a standard Get Request without any data size restrictions, it simplifies the retrieval of large datasets.
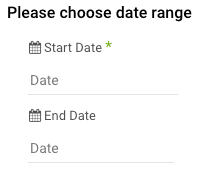
Setting the Time Range
Start Date: Initiate event extraction by specifying the Start date. To capture events up to the present day, leave the End date blank.
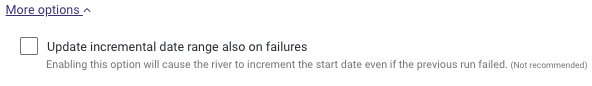
Please Note:
If a River run fails, the Start Date remains fixed. For those who prefer to update the Start Date regardless of River run success, navigate to 'More Options' and enable the setting to advance the Start Date (Not recommended).
Data Filtering by Date
Mixpanel permits filtering only on a daily basis, without the option for finer time intervals. To backtrack and capture data, use the 'Last days back' option.
Event Type Selection
Event Types: Choose the specific events for data extraction or leave blank to retrieve all events. A comprehensive list is available for selection, and additional events not listed can be manually added.
Best Practice: Instead of pulling all events in one River, it's recommended to categorize events by business relevance.

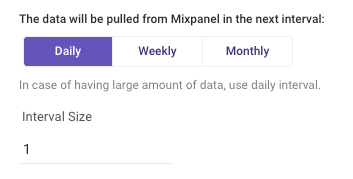
Data Interval Configuration
- Data retrieval is segmented into intervals to manage large datasets and prevent API overloads, with daily intervals set as the default.
- For extensive data retrieval periods, you may opt to widen these intervals to decrease the number of API requests.
- In scenarios with millions of events within the specified timeframe, maintain the retrieval intervals between 1-2 days to avoid Mixpanel service errors.
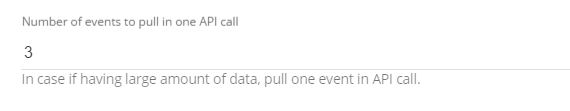
Events Per API Call
Rivery will partition large data requests into manageable event counts per API call. This segmentation ensures Mixpanel can efficiently process each request.
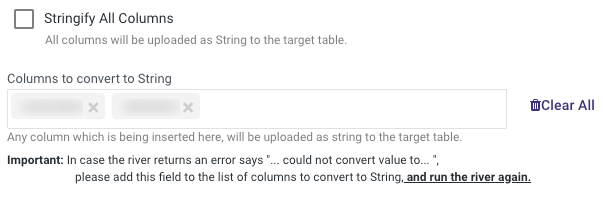
Handling Multi-Type Columns
Convert column to String: This setting resolves issues with columns containing multiple data types (e.g., both '6' and 'A' in a 'grade' column).
Initially, you can leave these settings blank until the mapping phase concludes.
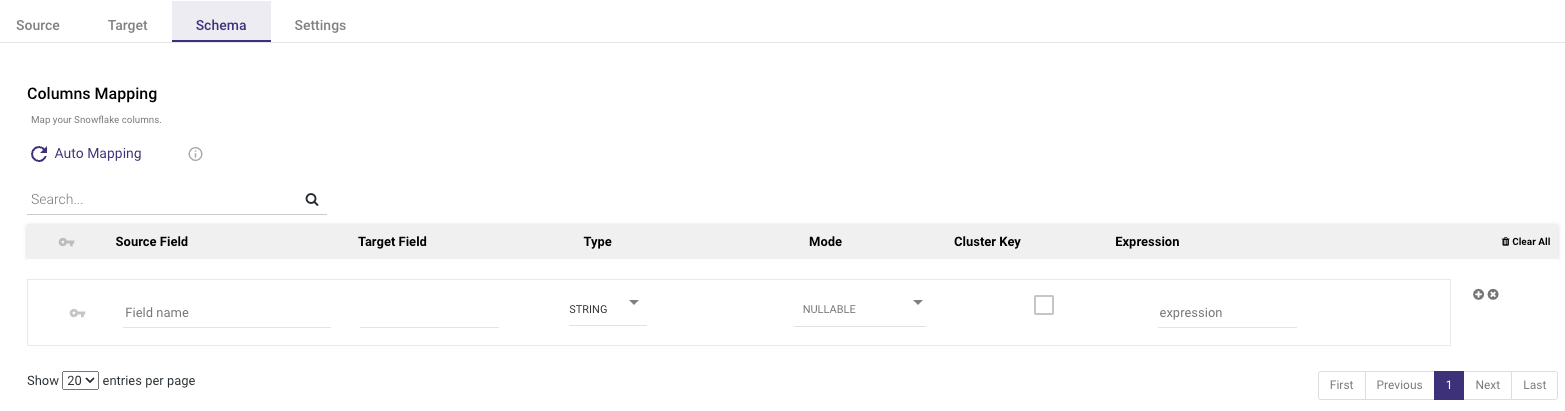
Upon auto-mapping, Rivery will indicate columns with multi-type issues. You have the option to exclude these columns or convert them to strings for data compatibility.
When converting to strings, all data within those columns will be treated as text, which aids in the data loading process to the target table.
Should Rivery not detect all multi-type columns and errors occur during data loading, the mapping can be adjusted accordingly.
Please Note:
For overall column type uniformity, the "Stringify all columns" option is available. This action is reversible by deselecting the option or removing columns from the conversion list and re-running the auto-mapping process.
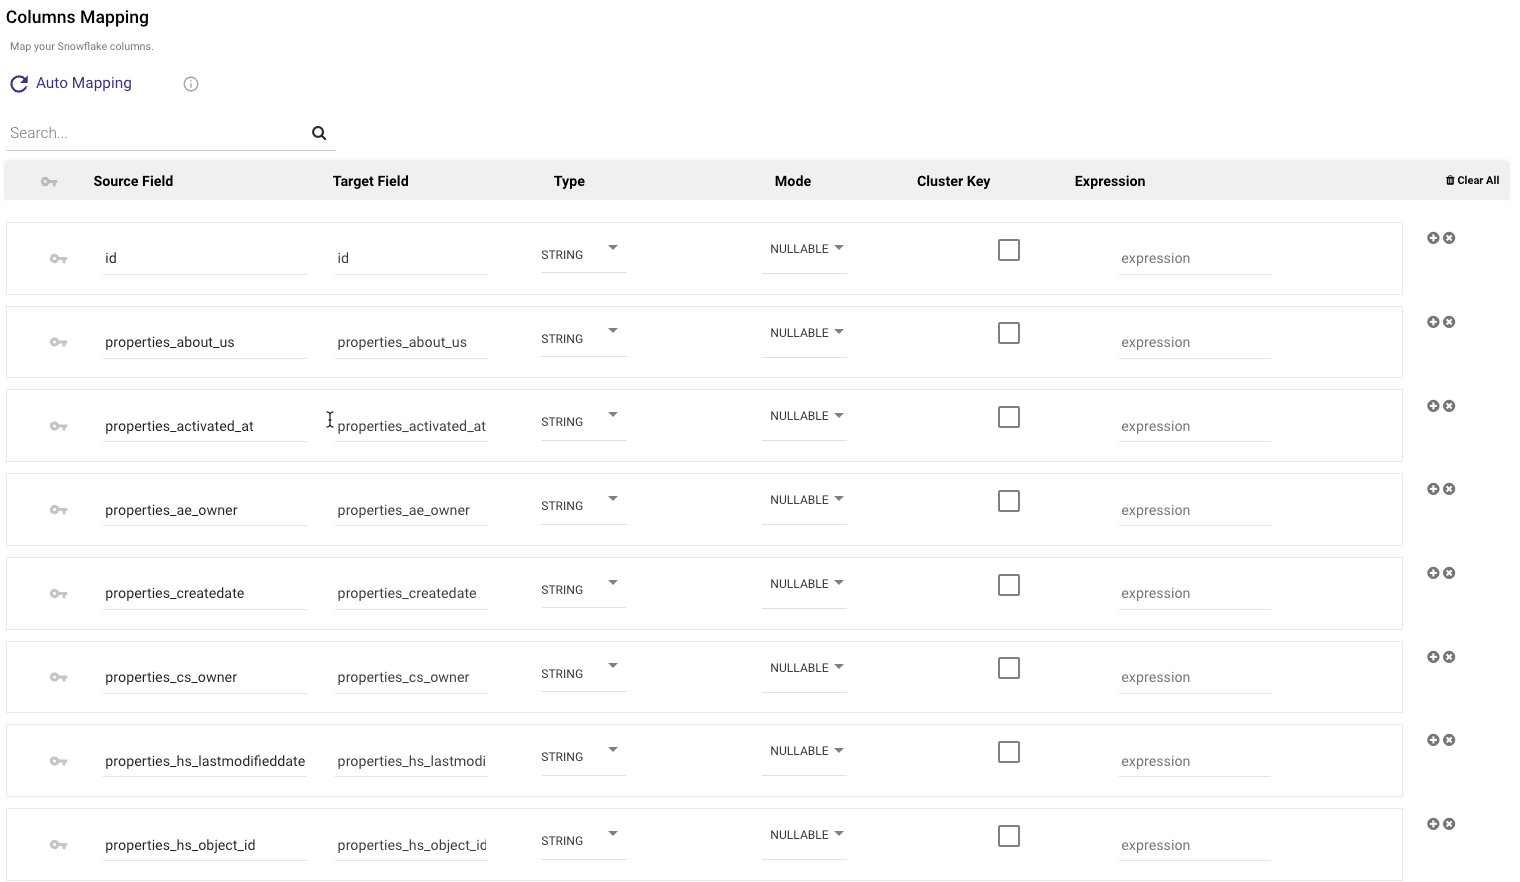
Flatten Arrays
Rivery provides the ability to flatten your Download Raw Data report array values. Flattening an array means transforming a multidimensional array into a one-dimensional array by concatenating all its elements.
If you would like to flatten report array values, follow the steps below:
- Check the “Flatten Arrays” checkbox.
- After checking the checkbox, each of the report's array values will be an individual column. Each array will be given an "array_name" alias in the schema mapping.
For example, the report's Properties array will have an alias of "properties_" for all values.
Please Note:
Flatten arrays option applies exclusively to the Download Raw Data report.
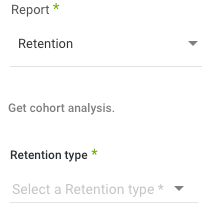
Retention
This report will provide the retention data in 3 different types: Recurring, First time and Addiction.
Select the retention report
Select the Start date to start pulling events from. Leave the end date empty in order to pull events until today.
- Use “days back” in order to pull data from a given number of days back before the start date. Can be useful in order to have retention report of some given last days.
- Hard start date - checking it will cause the river to always run from the given start date. Otherwise, it will be updated after the next run of the River.
Select the events for the Retention report. In the case of First time Retention report, it is possible to select an additional event.
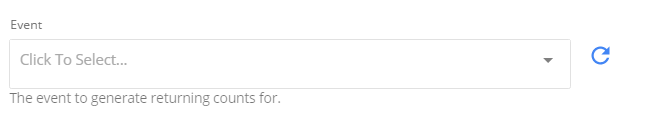
When clicking on the event input it will present a list of all available events.Click on ‘add condition’ in order to filter the results by events or user properties.
Select a segment for the Retention report in the “On” input (this input will be visible only after selecting an event).
1. When clicking on the input, a list with all the available properties of the event will be shown.
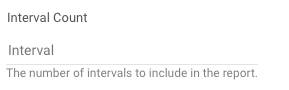
2. Please notice that when pulling a Retention report with a segment, the results won’t contain a date column. (However, it is possible to add a date column in the mapping which will contain the current date).Select an interval count for the retention report - how many days back the report will contain. Leaving it empty will result in 2 days only.
- Select a unit for the Retention report - decides the level of granularity. Days will return the Retention report in days and weeks/months will return the Retention report in weeks/months intervals.

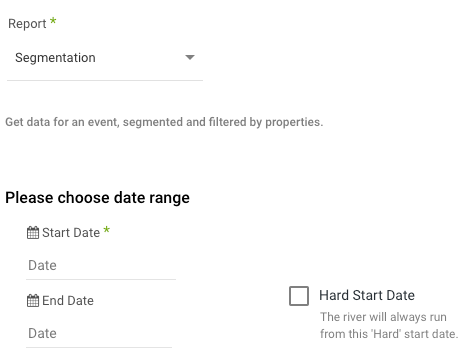
Segmentation
This report provides a segmentation report with zero, one or two segments.
Select the Start date to start pulling events from. Leave the end date empty in order to pull events until today.
1. Use “days back” in order to pull data from a given number of days back before the start date. Can be useful in order to have retention report of some given last days.
2. Hard start date - checking will cause the river to always run from the given start date. Otherwise, it will be updated after the next run of the river.
- Select the event for the Segmentation report.
When clicking on the event input it will present a list of all available events.
Click on ‘add condition’ in order to filter the results by events or user properties.
Select segments for the Segmentation report in the “On” input (this input will be visible only after selecting an event).
When clicking on the input, a list of all the available properties of the event will be shown.
- Select the level of granularity in the Segmentation report. Each level will change the granularity of the time in the results (for example week will result as every row is a week and month will result as every row is a month).
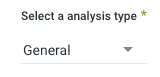
- Select the analysis type of the Segmentation report. This input determines the nature of the count in the report. General is the total count.
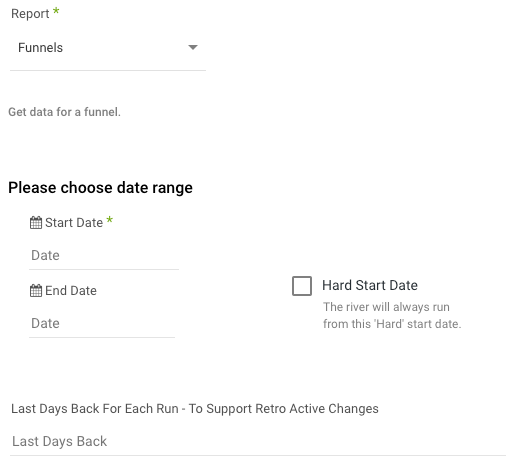
Funnels
Select the Start date to start pulling events from. Leave the end date empty in order to pull events until today.
a. Use “Last days back” in order to pull data from a given number of days back before the start date. Can be useful in order to have retention report of some given last days.
b. Hard start date - checking it will cause the river to always run from the given start date. Otherwise, it will be updated after the next run of the River.
Select the Funnel to have the results for. When clicking on the input a list with all the Funnels in the account will be shown.
Click on “add overview condition” in order to filter the results by some properties. Please note that those conditions will be effective in an overview look of the funnel (and not for a specific event that composes the funnel).
Select segments for the Funnel report in the “On” input.
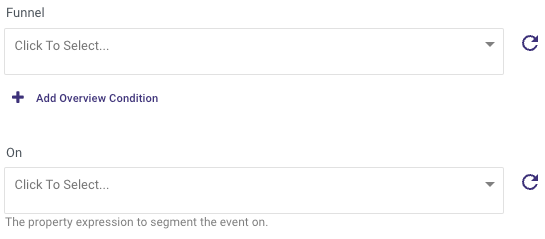
When clicking on the input, a list of all the available properties of the event will be shown.
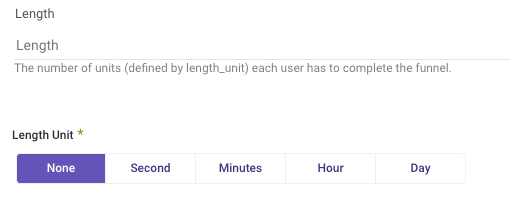
- Select the length unit and the unit of the funnel report. The default is the settings of the original funnel in Mixpanel.
Time resolution - Determines the resolution of the results.
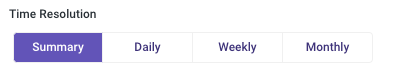
1. Results of the funnels report is a record for each event that composes the funnel and time range (columns date and to_date in the results).
2. The summary will result in a record for each event in the funnel for all the time range. Any other resolution will result in a record for an event and the selected time resolution.
3. For example, for a funnel with two events A & B, the results of a funnel report for 14 days will result in 2 rows in case of summary resolution (2 rows for each event that contains the all-time range), and in case of daily resolution the results will contain 28 rows (1 row for each event and day). Please note that in order to refer to unique metrics it is important to pull the funnels report in a Summary resolution. T he results in the Mixpanel UI are only in Summary resolution.
Profiles
This report provides all the users in the mixpanel account.
The results will contain all the users in the Mixpanel account at the time of running the report.
Input Stringify lists - The results contains columns which are lists. In order to have those lists in String types in the target table, select this checkbox.
Events, Events Properties
General reports that provide a summary analysis of the selected events and properties.
The results contain the count of the event/property per each day in the time range.
Events top, Events Properties top, Event property values, User properties, User property values.
These reports provide look-up tables that contain the data in the Mixpanel account.
Export Raw Data
The Export Raw Data report mirrors the Download Raw Data report in functionality but employs JQL, which imposes a 5GB limit on data retrieval.
Was this article helpful?